Use the zettelkasten dashboard
Launch the zettelkasten visualizer and find your way around its tabs. This is the interactive graph explorer for a literature-review corpus — sources, notes, spines, and matrices. For why the corpus is layered the way it is, see Zettelkasten and Spines.
This is not the memory dashboard
Two different dashboards ship with angelo. This page covers the zettelkasten
one (console script angelo-zk-dashboard). The research-tree/sessions UI is a
separate app — see Use the memory dashboard for that one.
Launch it
- Confirm the zettelkasten capability is enabled and its MCP server is green in Settings → MCP. If not:
- From a chat, launch the dashboard through the zettelkasten MCP's
launch_dashboardtool:
The tool returns a local URL. In a source checkout it also starts a live-reload dev server; in a plain install the backend serves the bundled UI itself.
Skip the chat
You can start it directly from a shell instead:
Do not run angelo-dashboard for this — that launches the memory
dashboard, a different app on a different port.
- Open the URL and pick a project (or a single source) from the picker in the top-left. Projects are composite views over many sources; a source is one ingested document's graph.
Tour the tabs
The view switcher sits at the top-right. Four tabs share the same picker, search box, and tag filters.
Concepts
The default graph view. Notes render as nodes; how they're arranged depends on the active arrangement:
- Semantic clusters draw as halos around related notes (the intrinsic arrangement every corpus already has).
- Selecting a materialized spine re-lays the graph as a radial spine tree around the spine's apex and dimension nodes.
- A spine-group matrix colors nodes by their matrix cell.
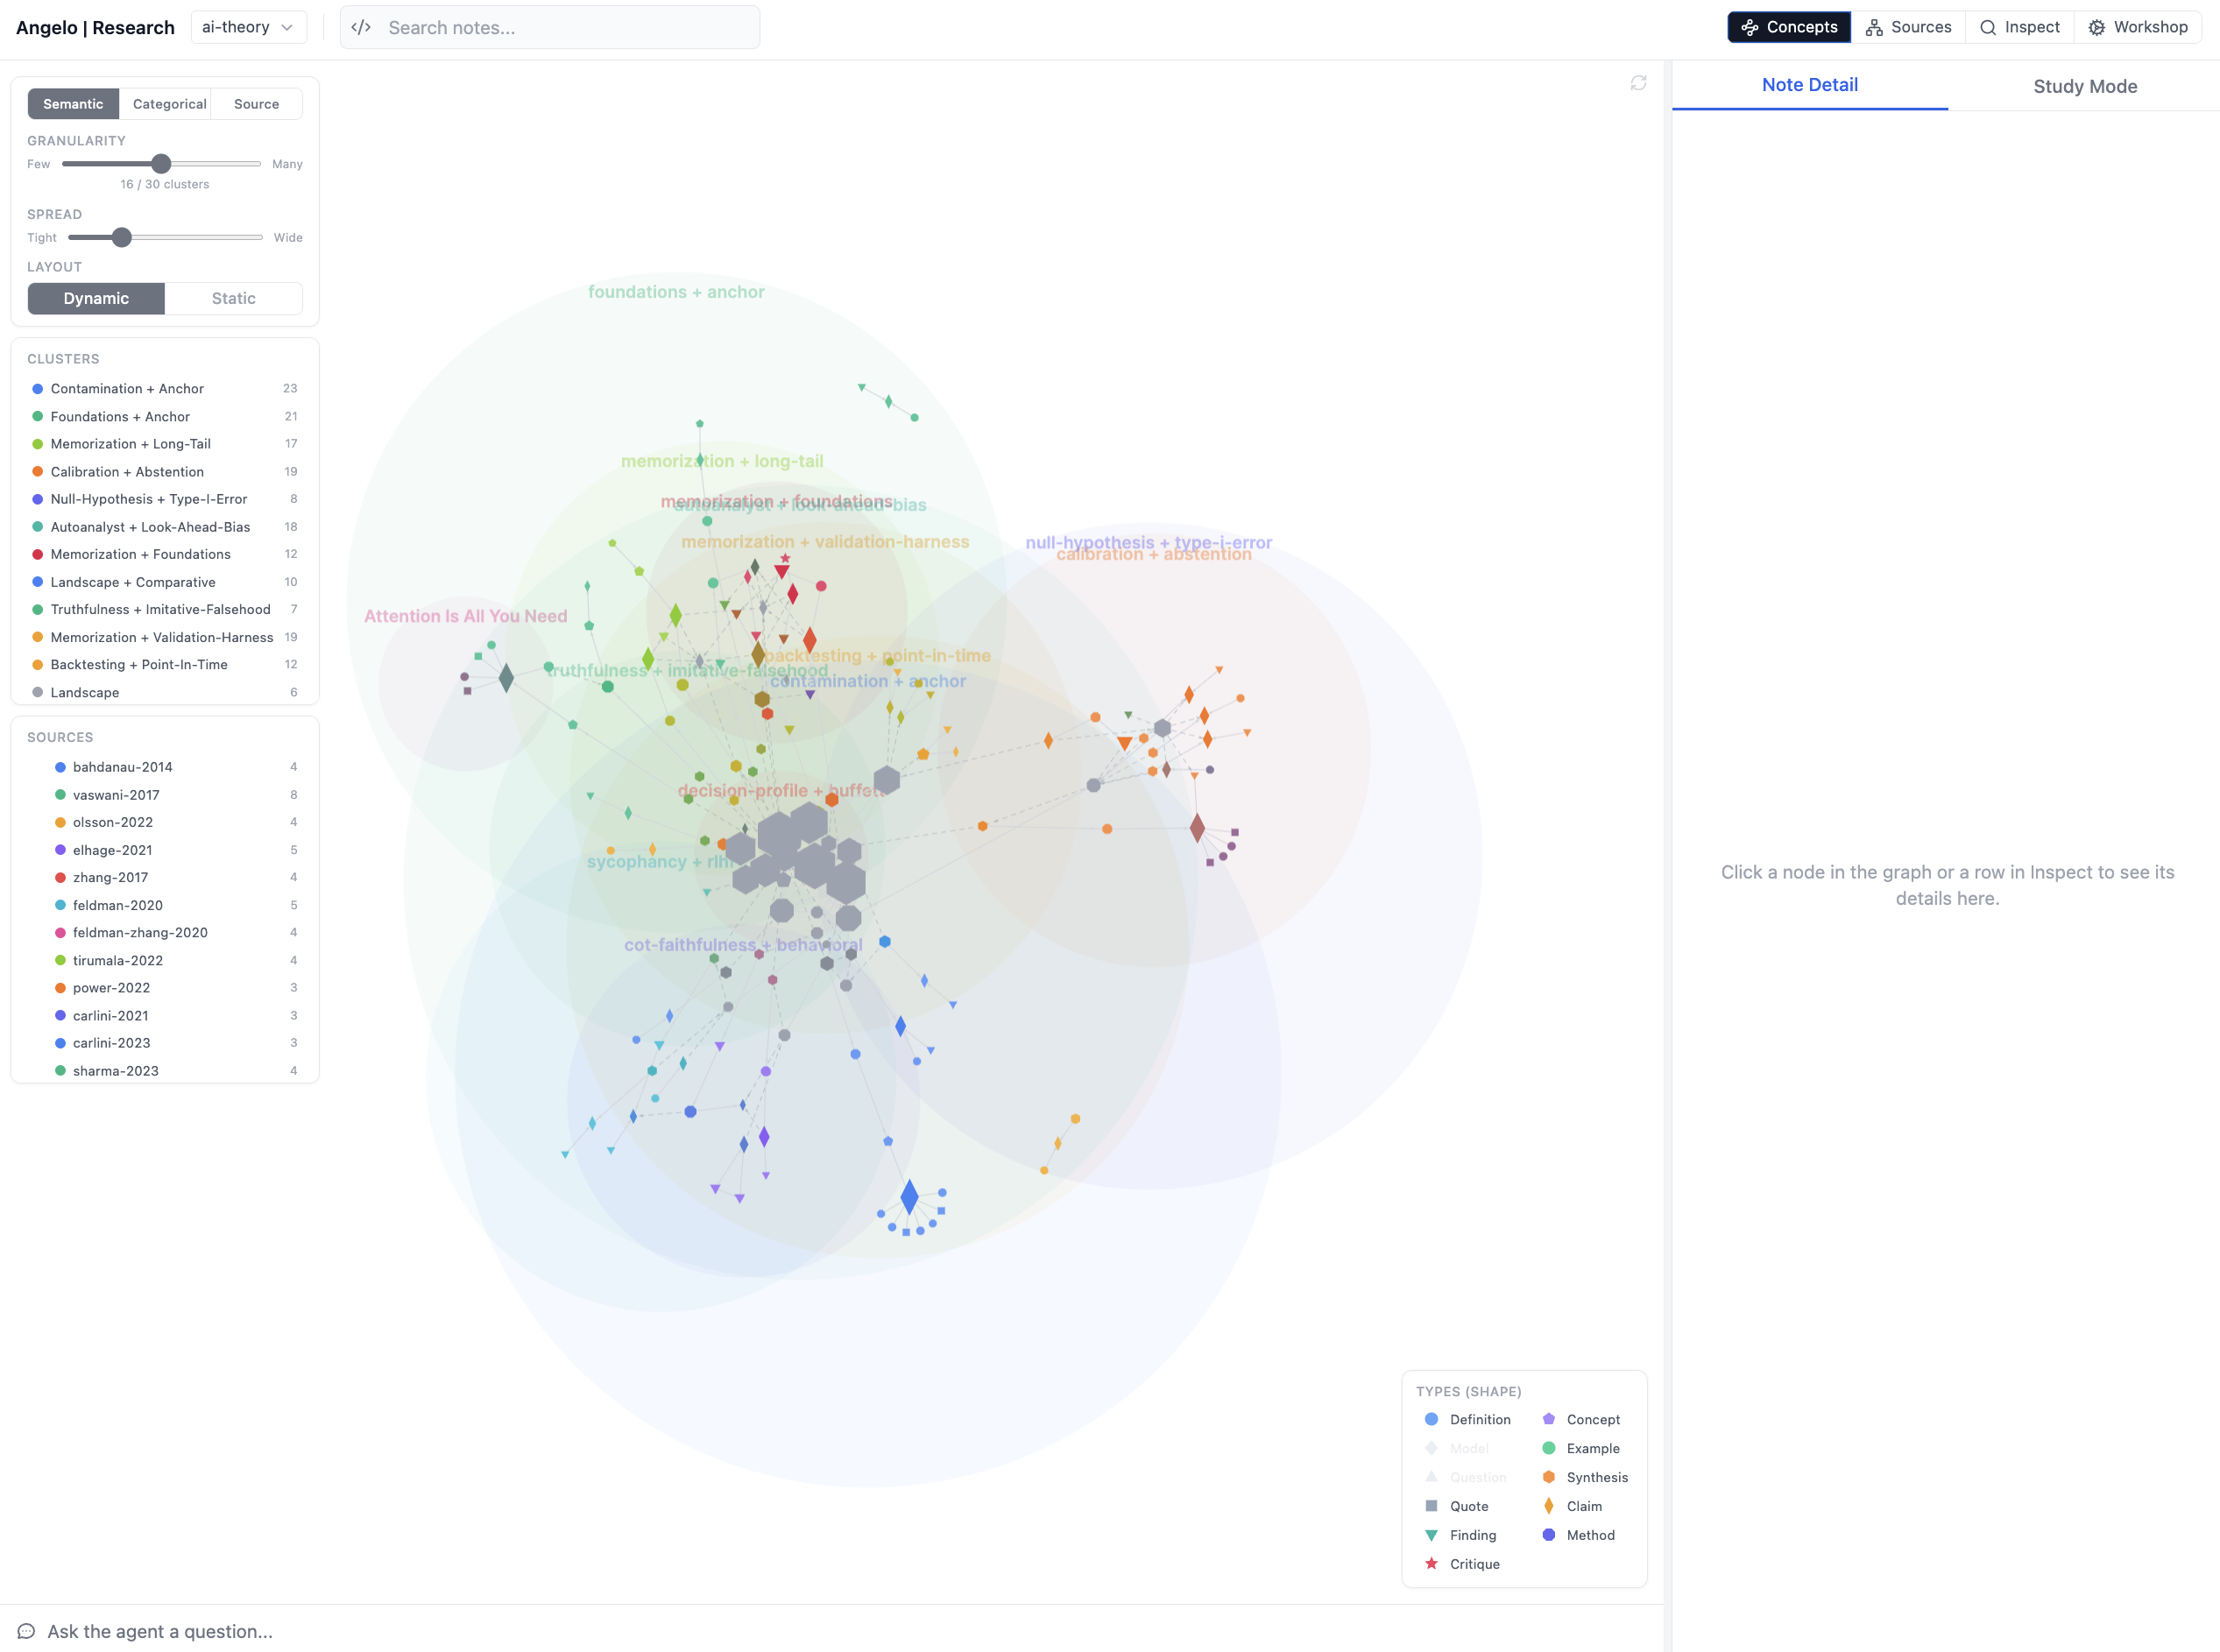
The Concepts view — notes as a force graph, grouped into semantic clusters; node shapes encode note type (definition, claim, finding, method…).
Organize by appears only when there's a spine
The Organize by selector — which switches the active arrangement — only shows up once at least one materialized spine exists (progressive disclosure). A brand-new corpus with only the intrinsic arrangement won't show it yet. Build one first: see Promote a spine.
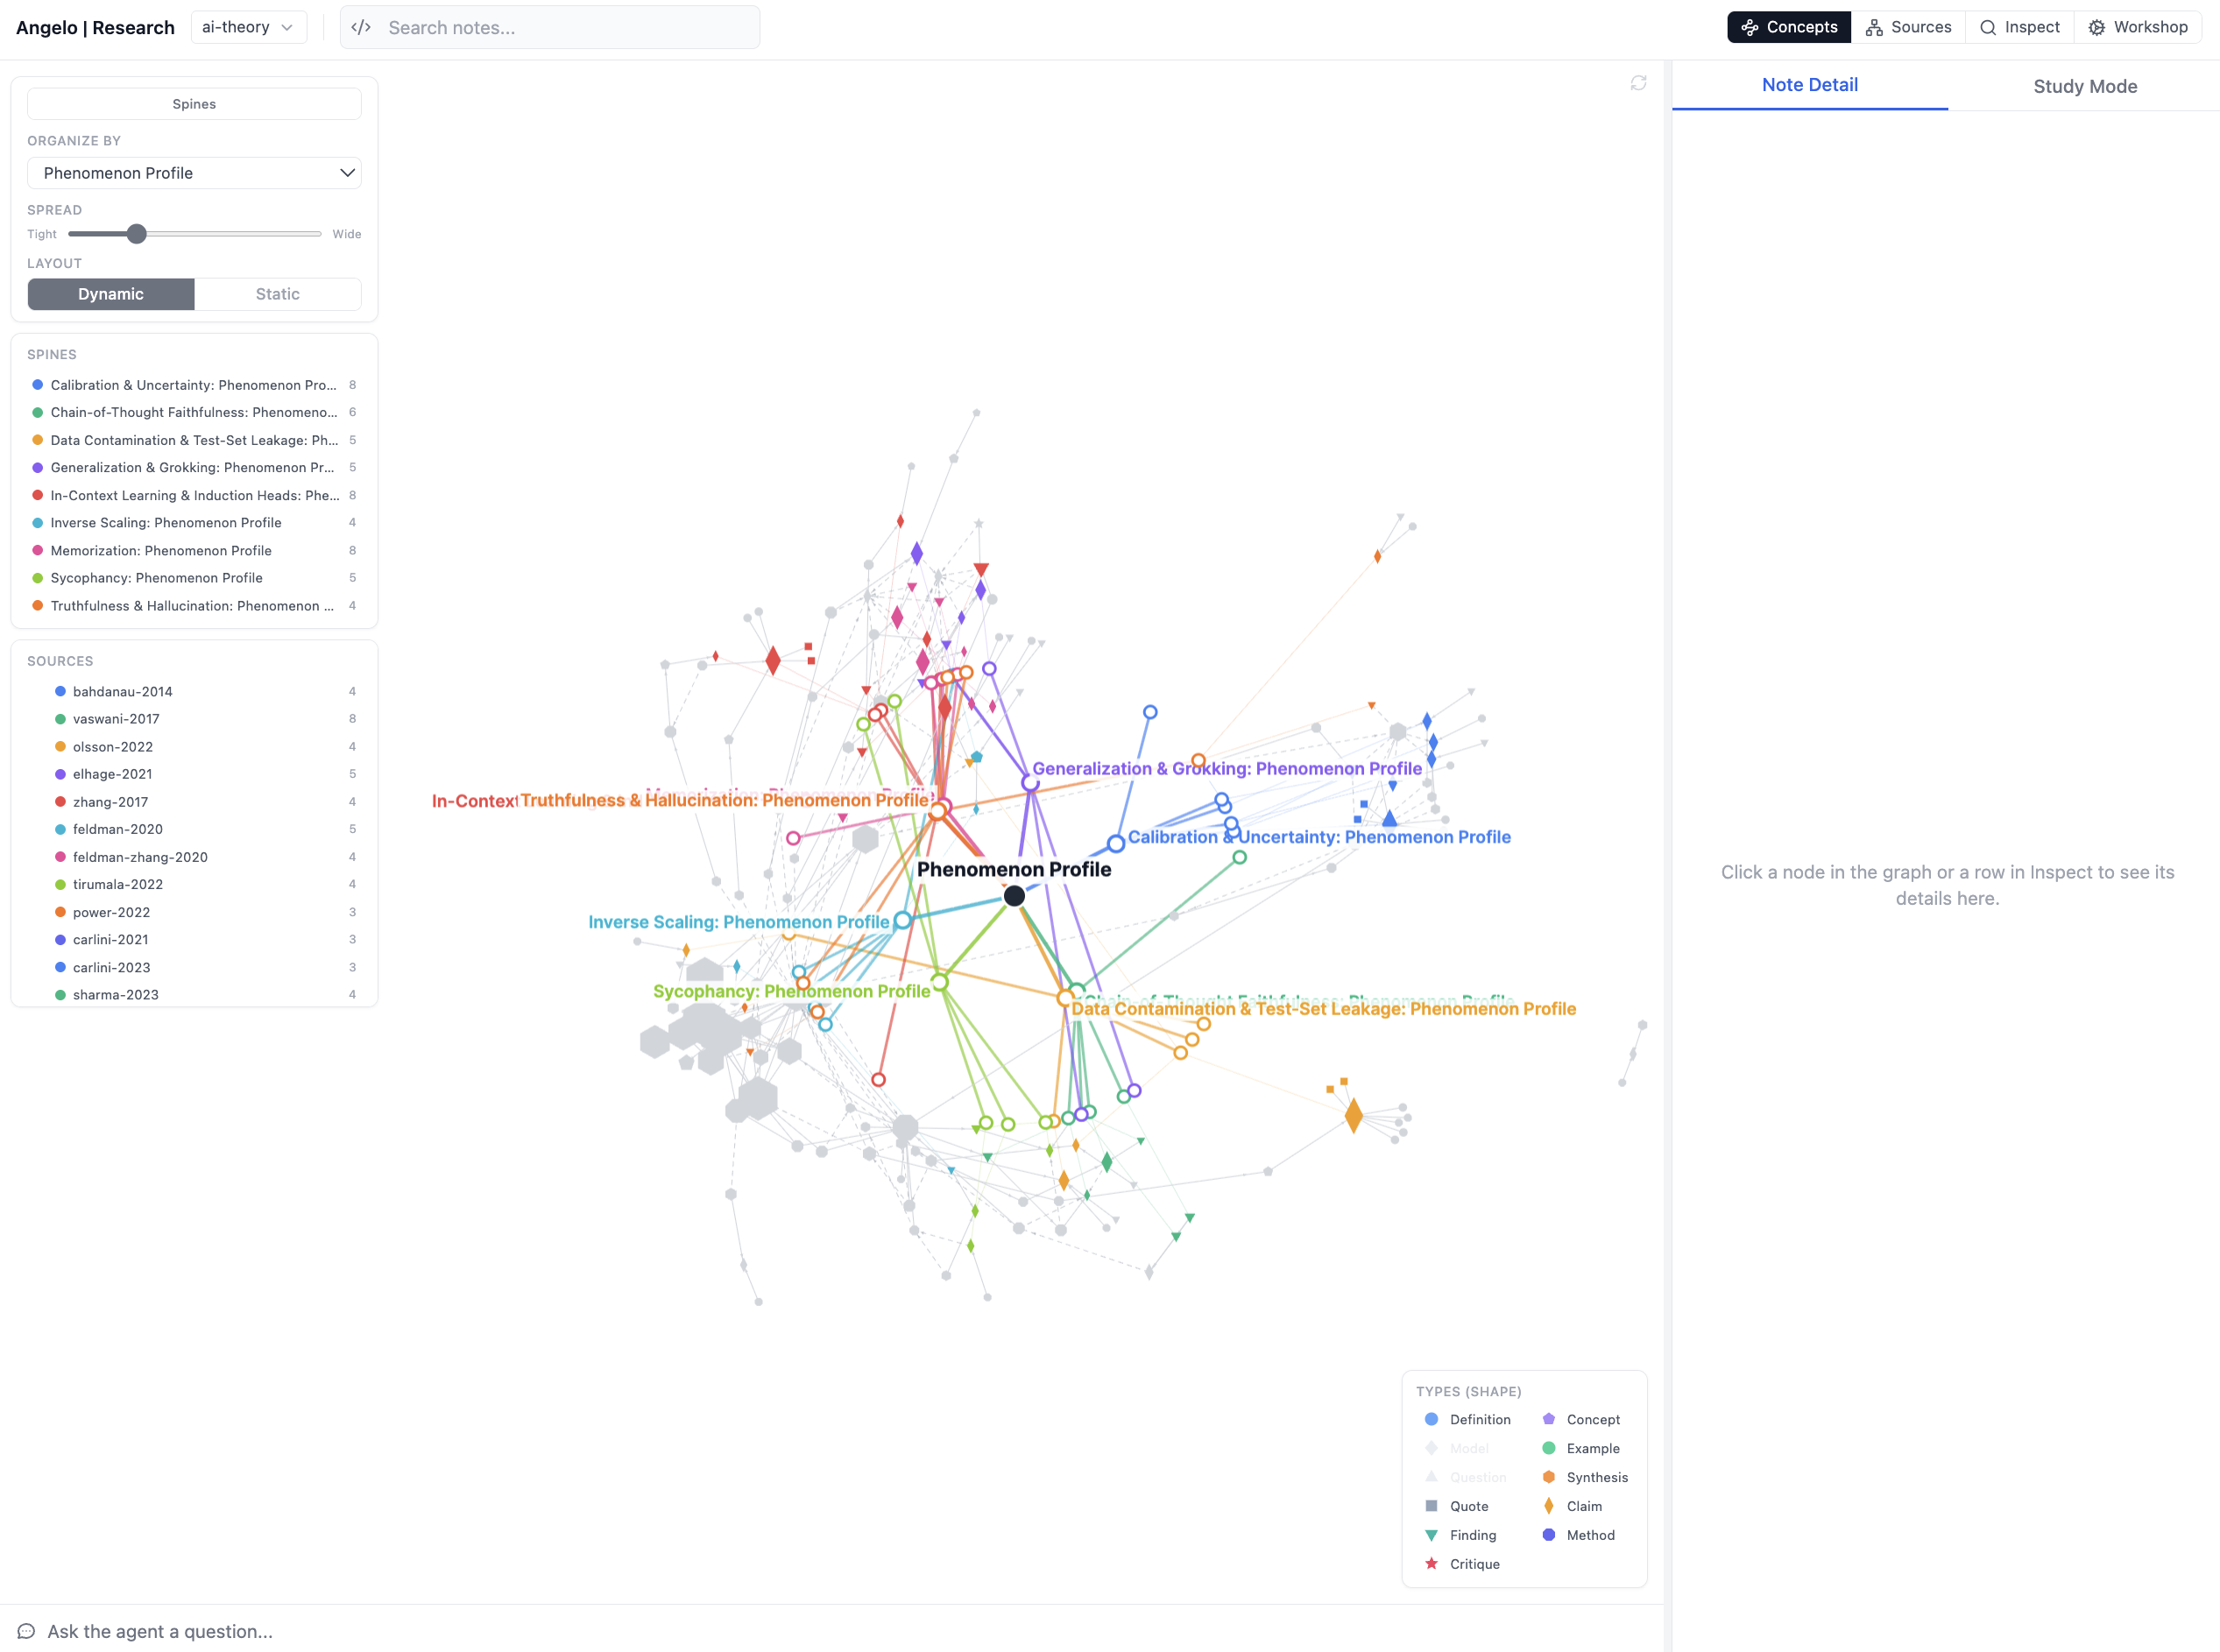
The same Concepts graph with Organize by set to a spine — re-laid as a radial spine tree around its apex. See Spines.
Sources
The source-centric graph: notes grouped under the papers/documents they came from, so you can see coverage per source and hide sources you don't want in view.
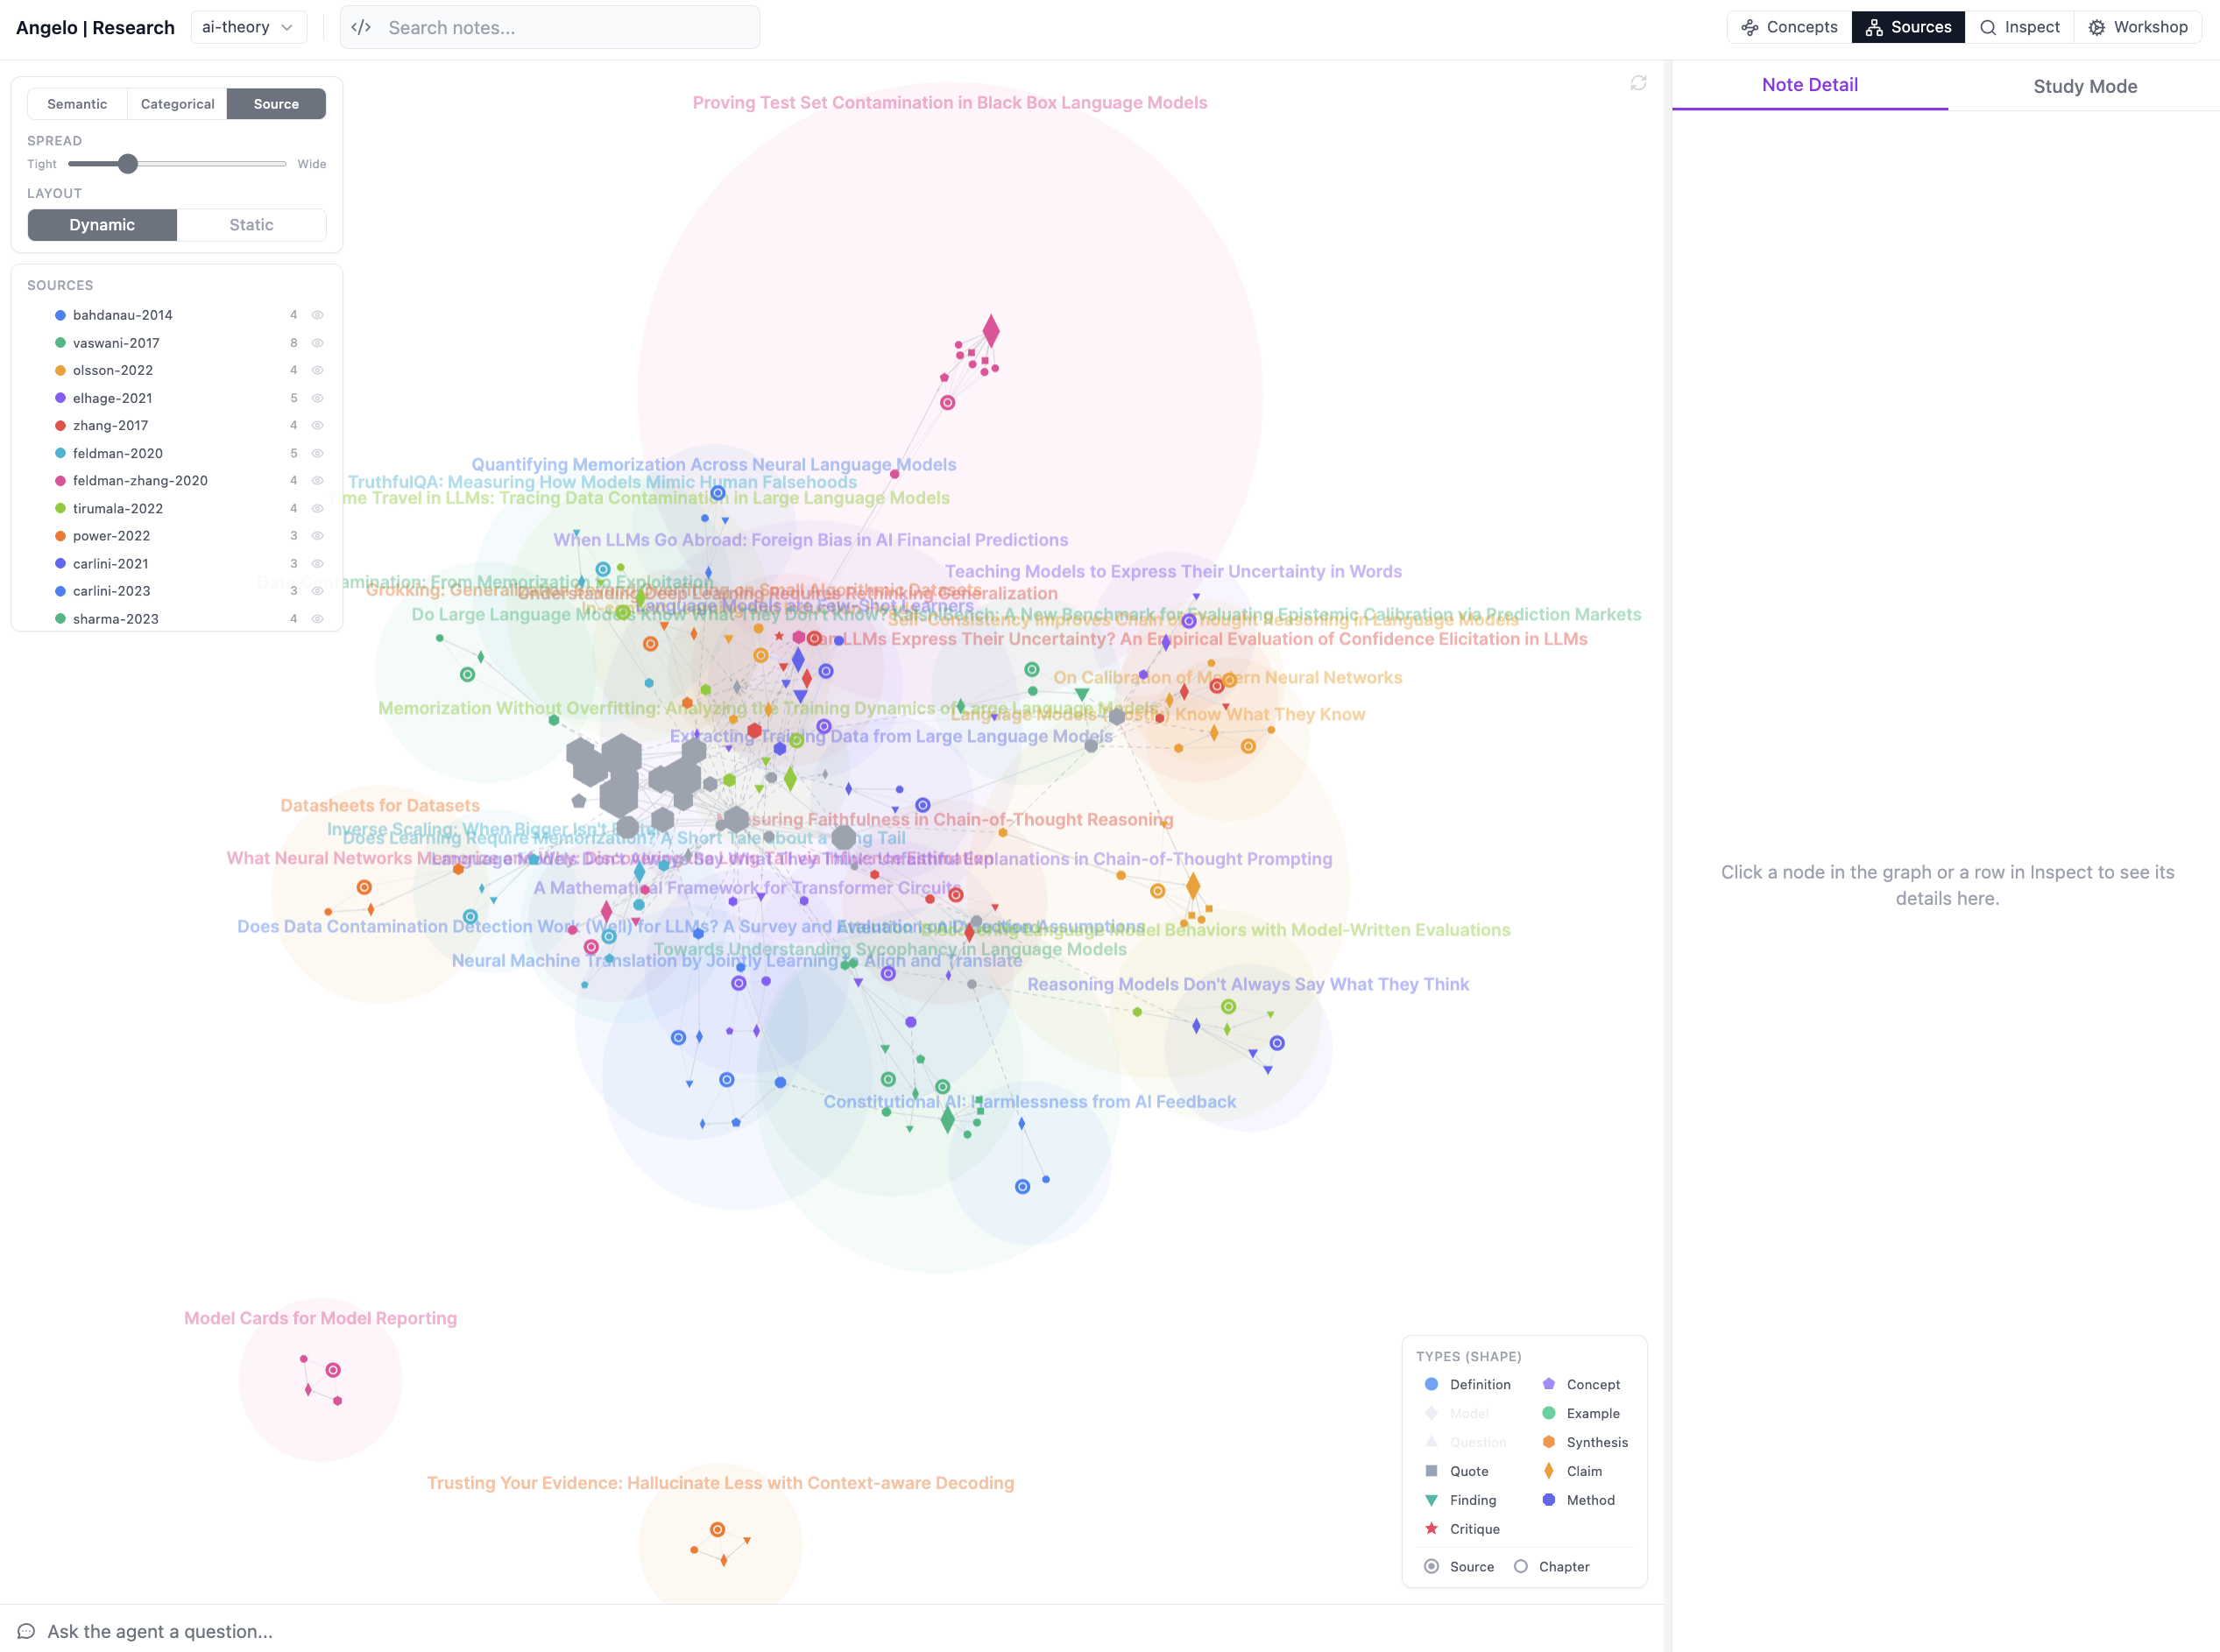
The Sources view — the same notes grouped under the papers they were extracted from, so you can gauge coverage per source and toggle sources on and off.
Inspect
A searchable, tabular listing of the corpus — good for scanning, filtering by type/tag, and jumping to a note without hunting for its node in the graph. It has sub-tabs for Papers (a scored reading list), Terms (the working dictionary), and Concepts (the ideas index).
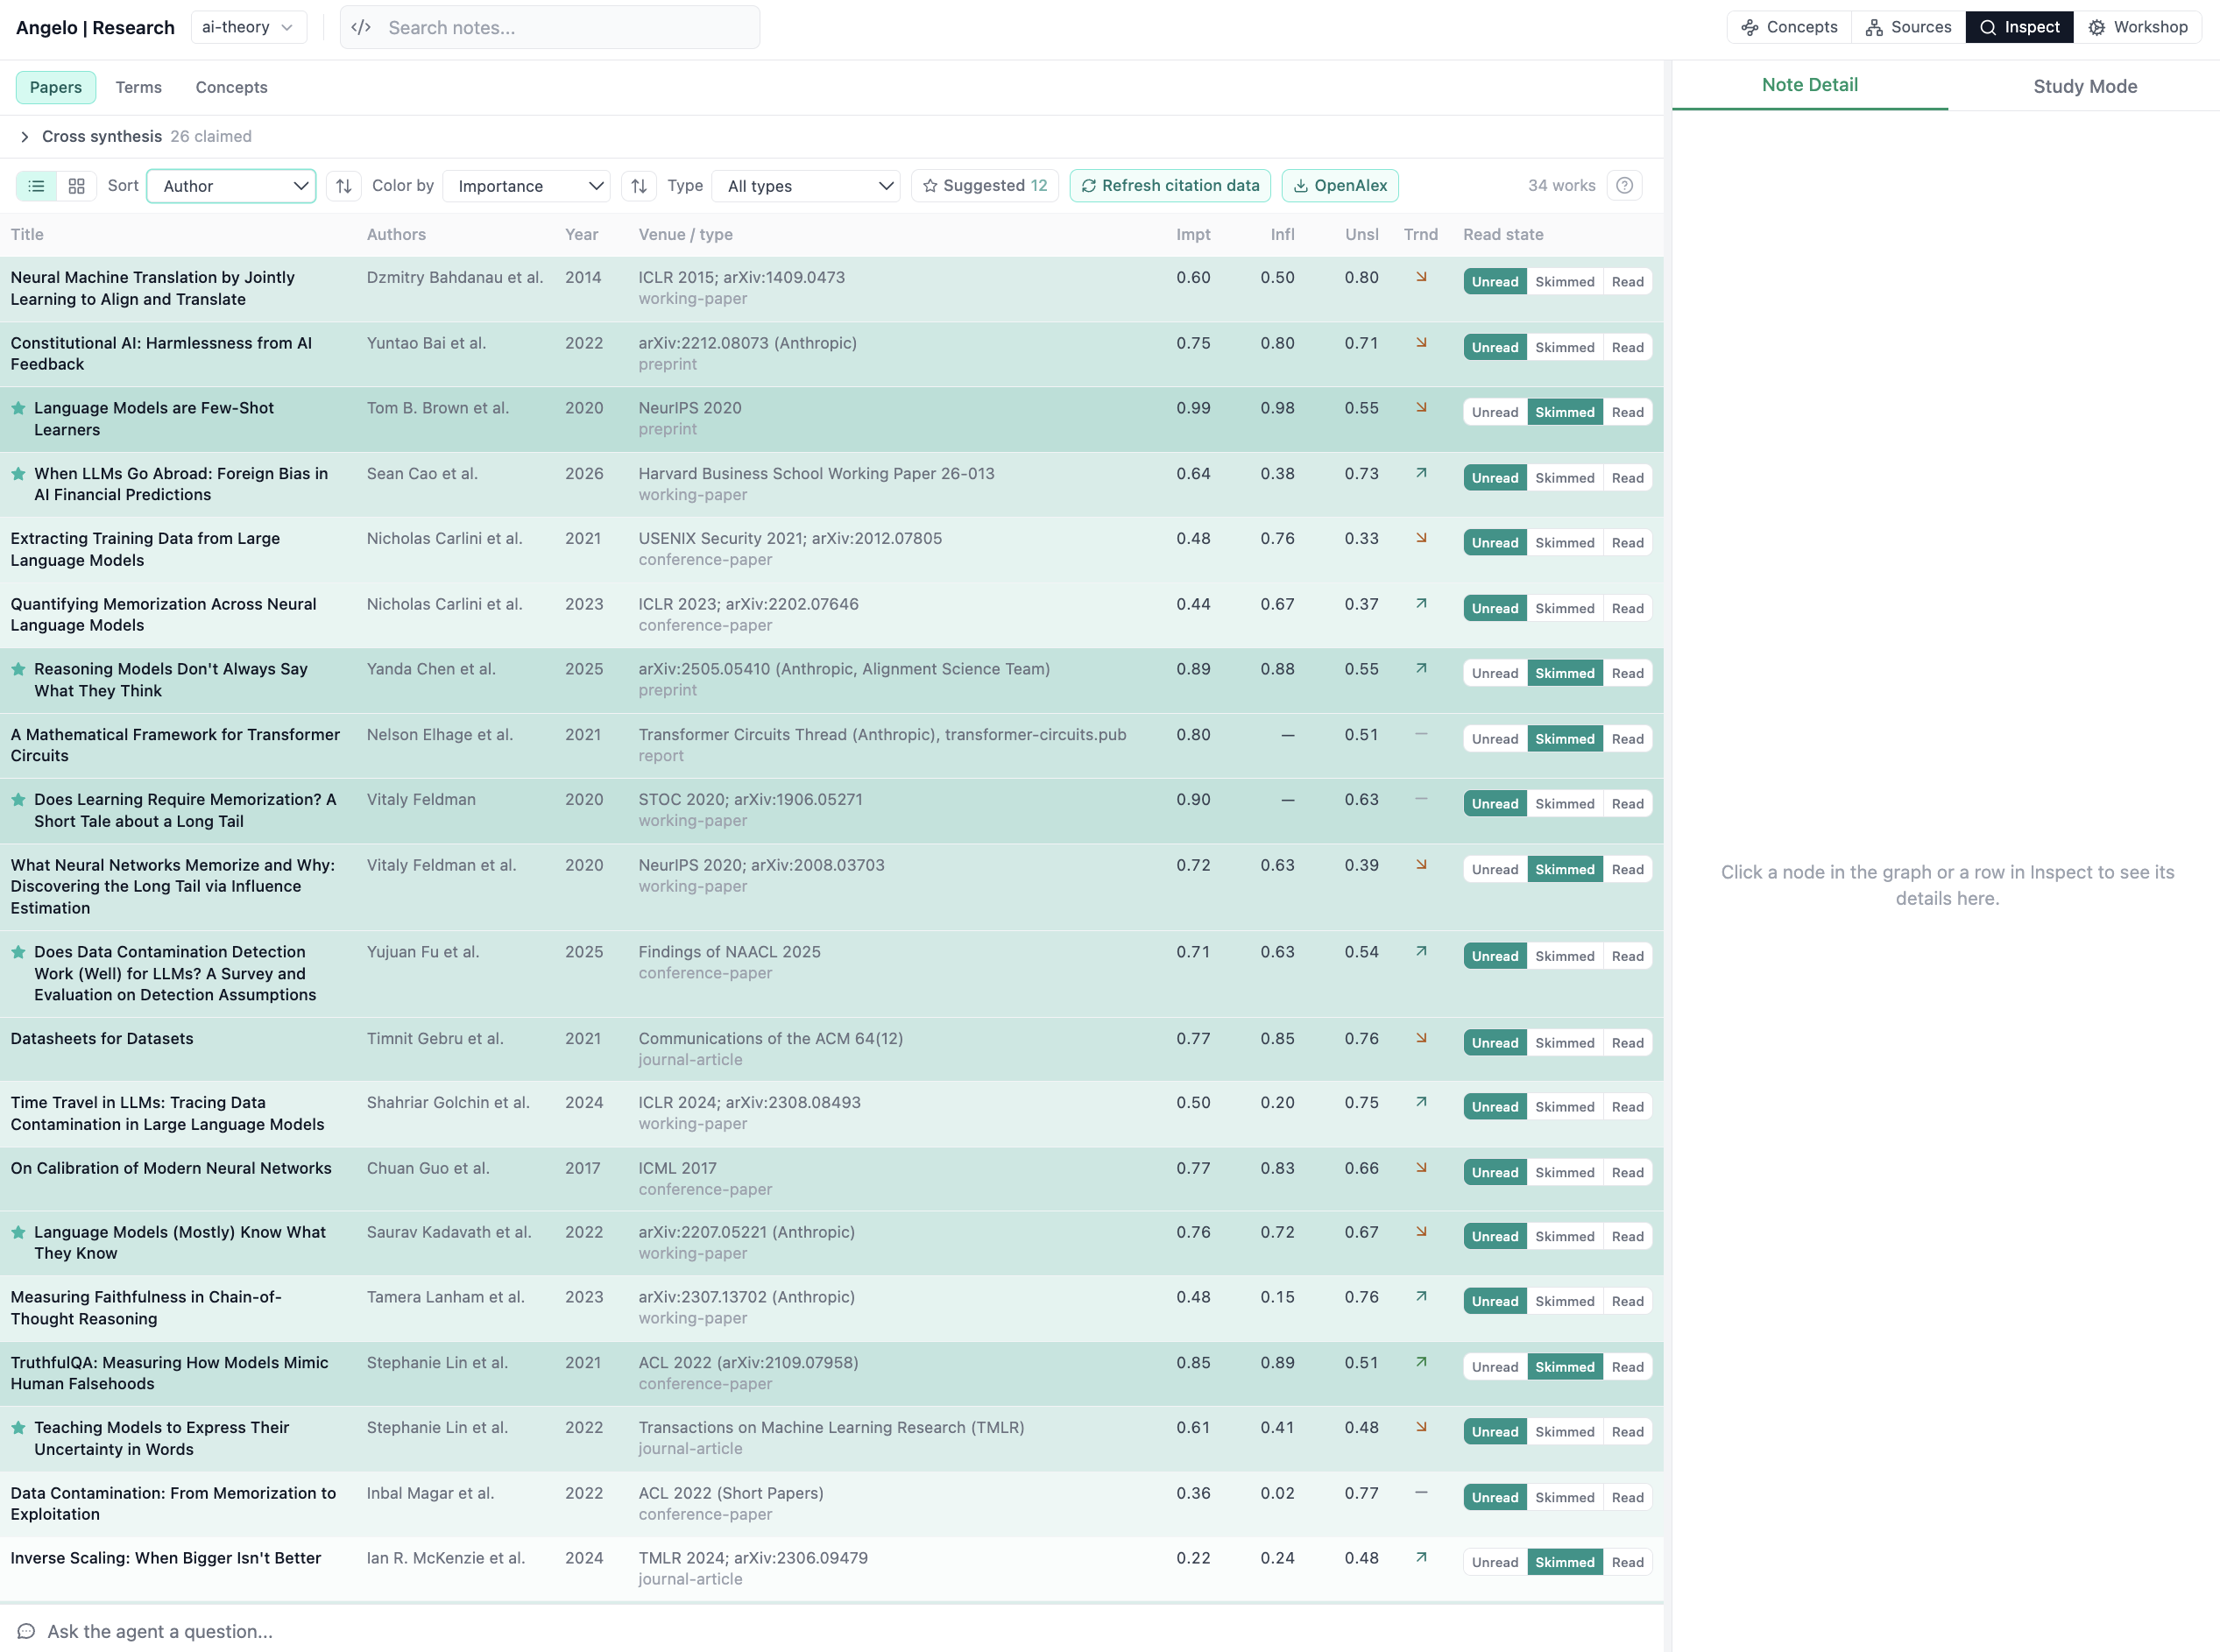
Inspect → Papers — the reading list scored by importance / influence / trajectory, with read-state tracking and a suggested reading set.
Workshop
The review workspace. Pick (or create) a review, then switch its body between four modes with the toggle at the top-right of the pane:
- Board — organize claims into themed sections.
- Draft — a bullet-point rendering of that board.
- Matrix — compare rows across typed columns (see Build a matrix).
- More tools — notes, hypothesis testing, gaps, and acquisition.
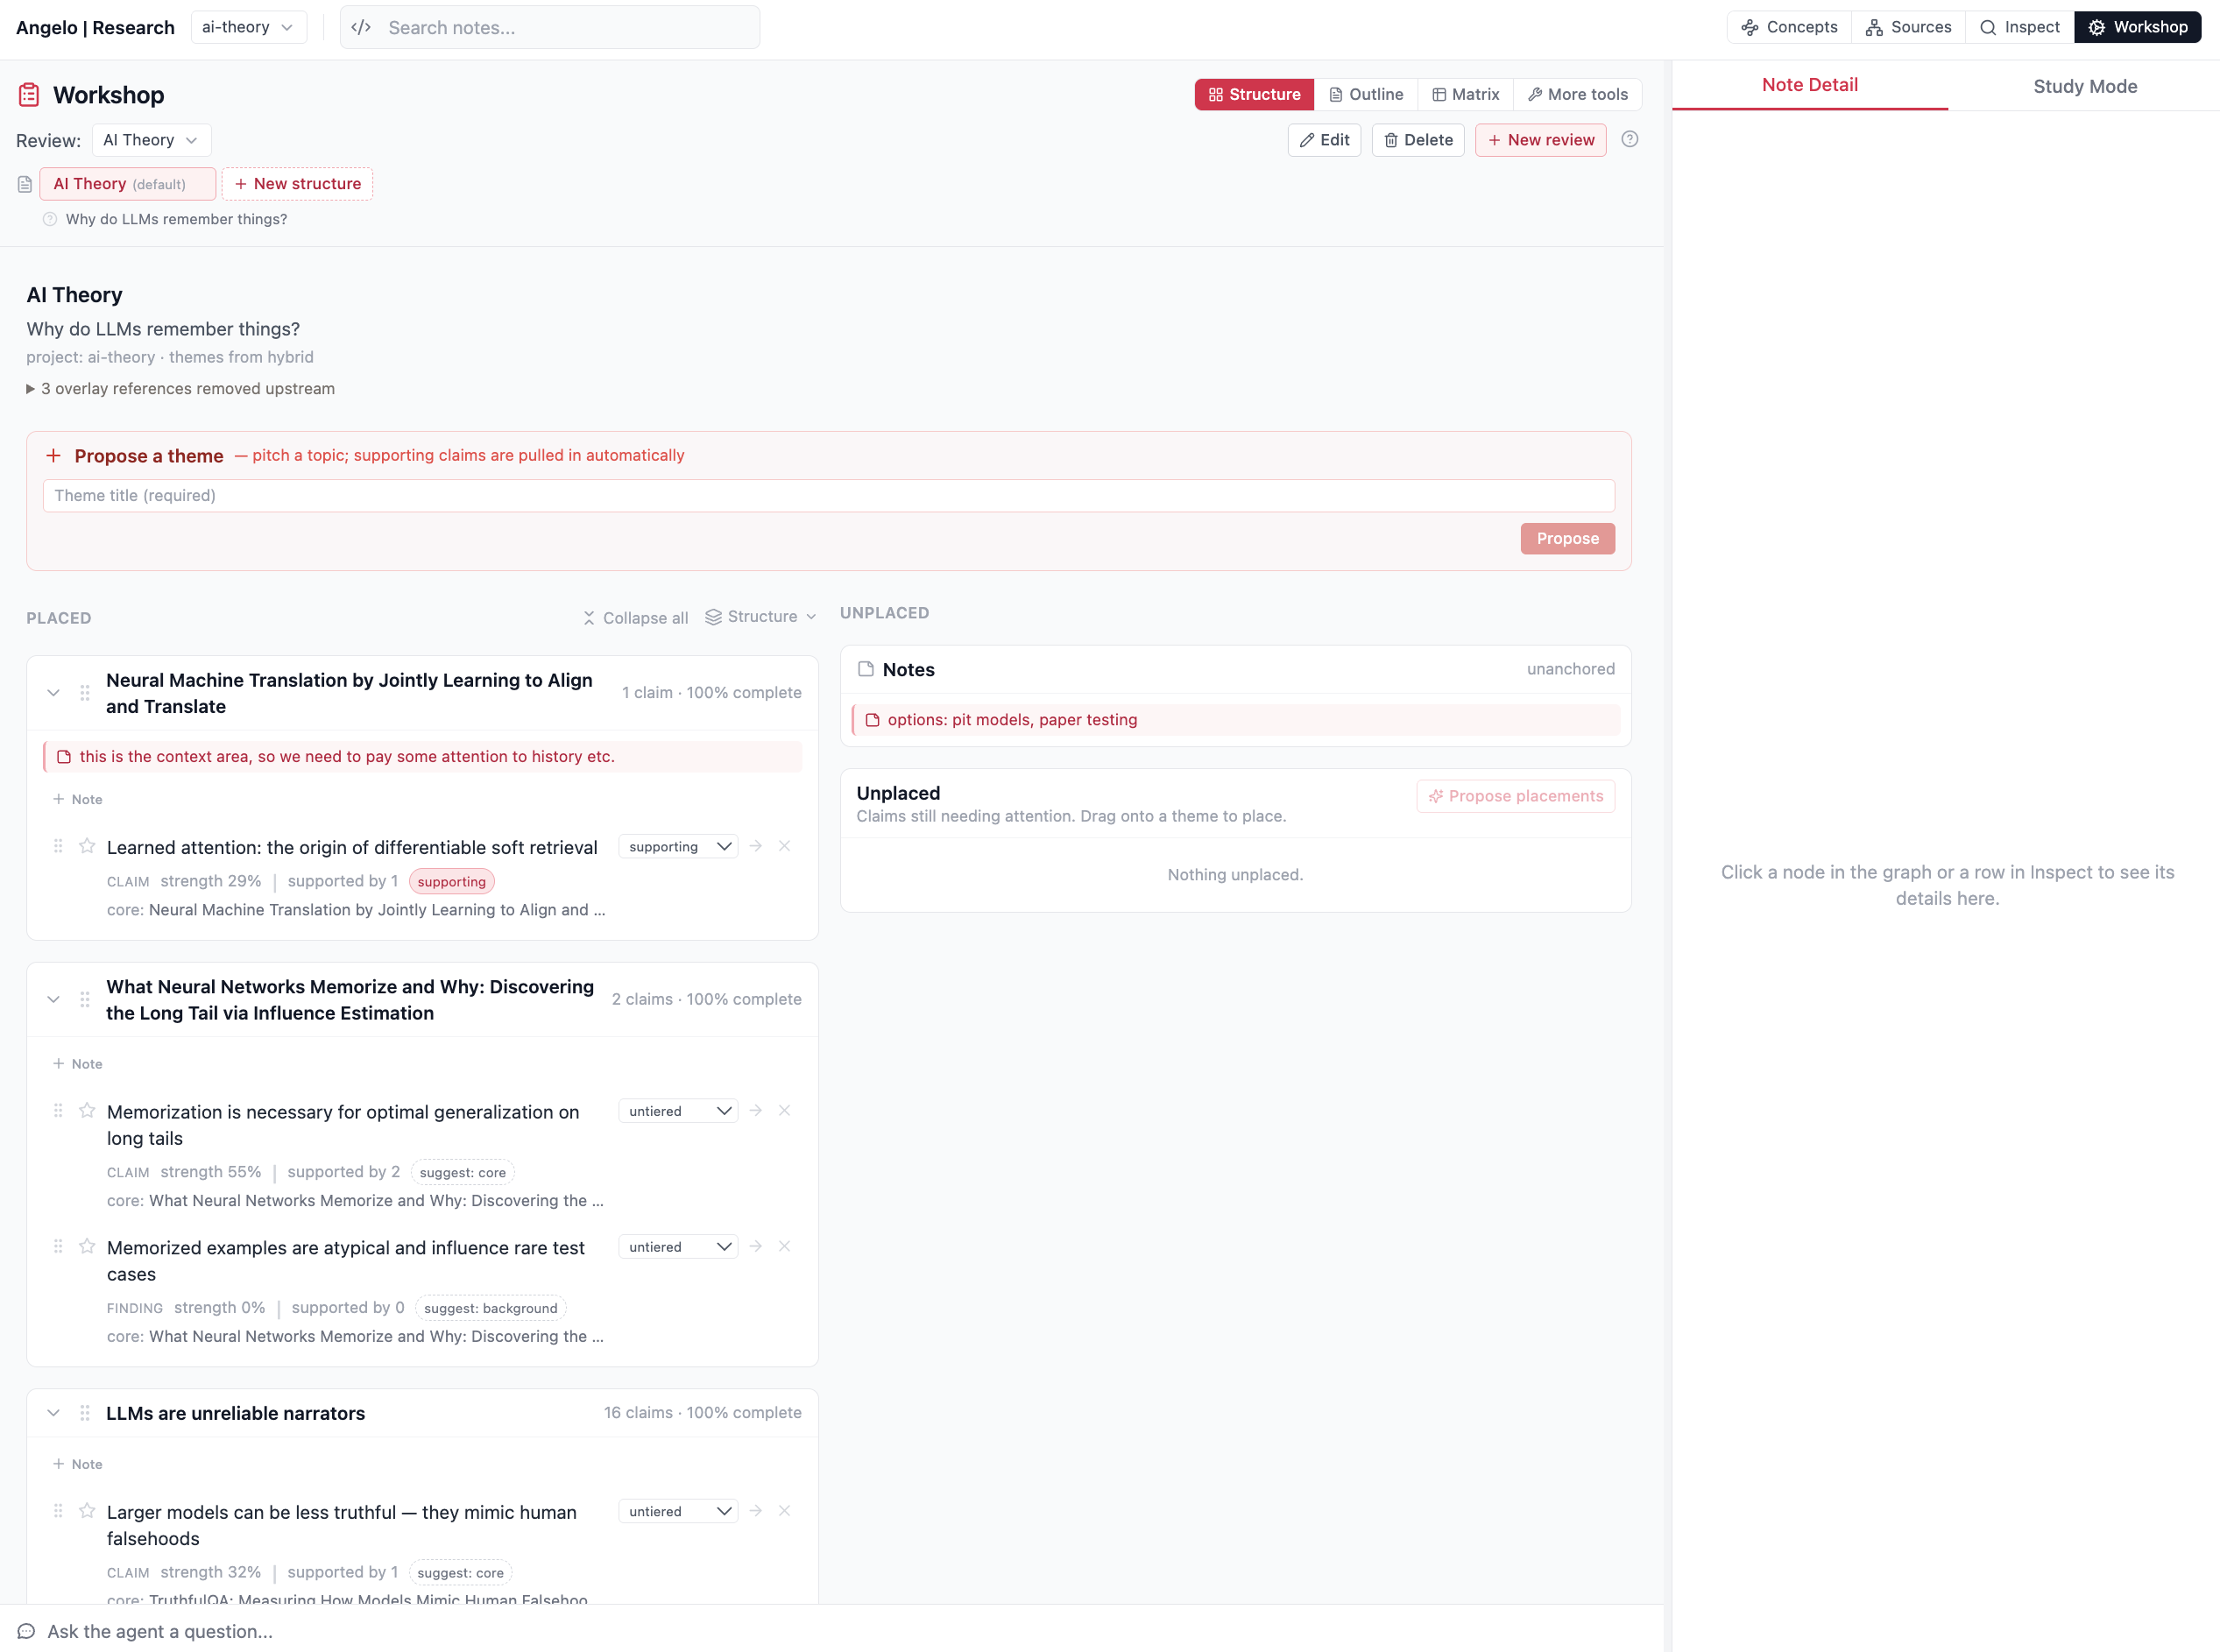
Workshop → Board — claims organized into themed sections (each with its supporting claims and completeness), with an Unplaced column for claims still needing a home.
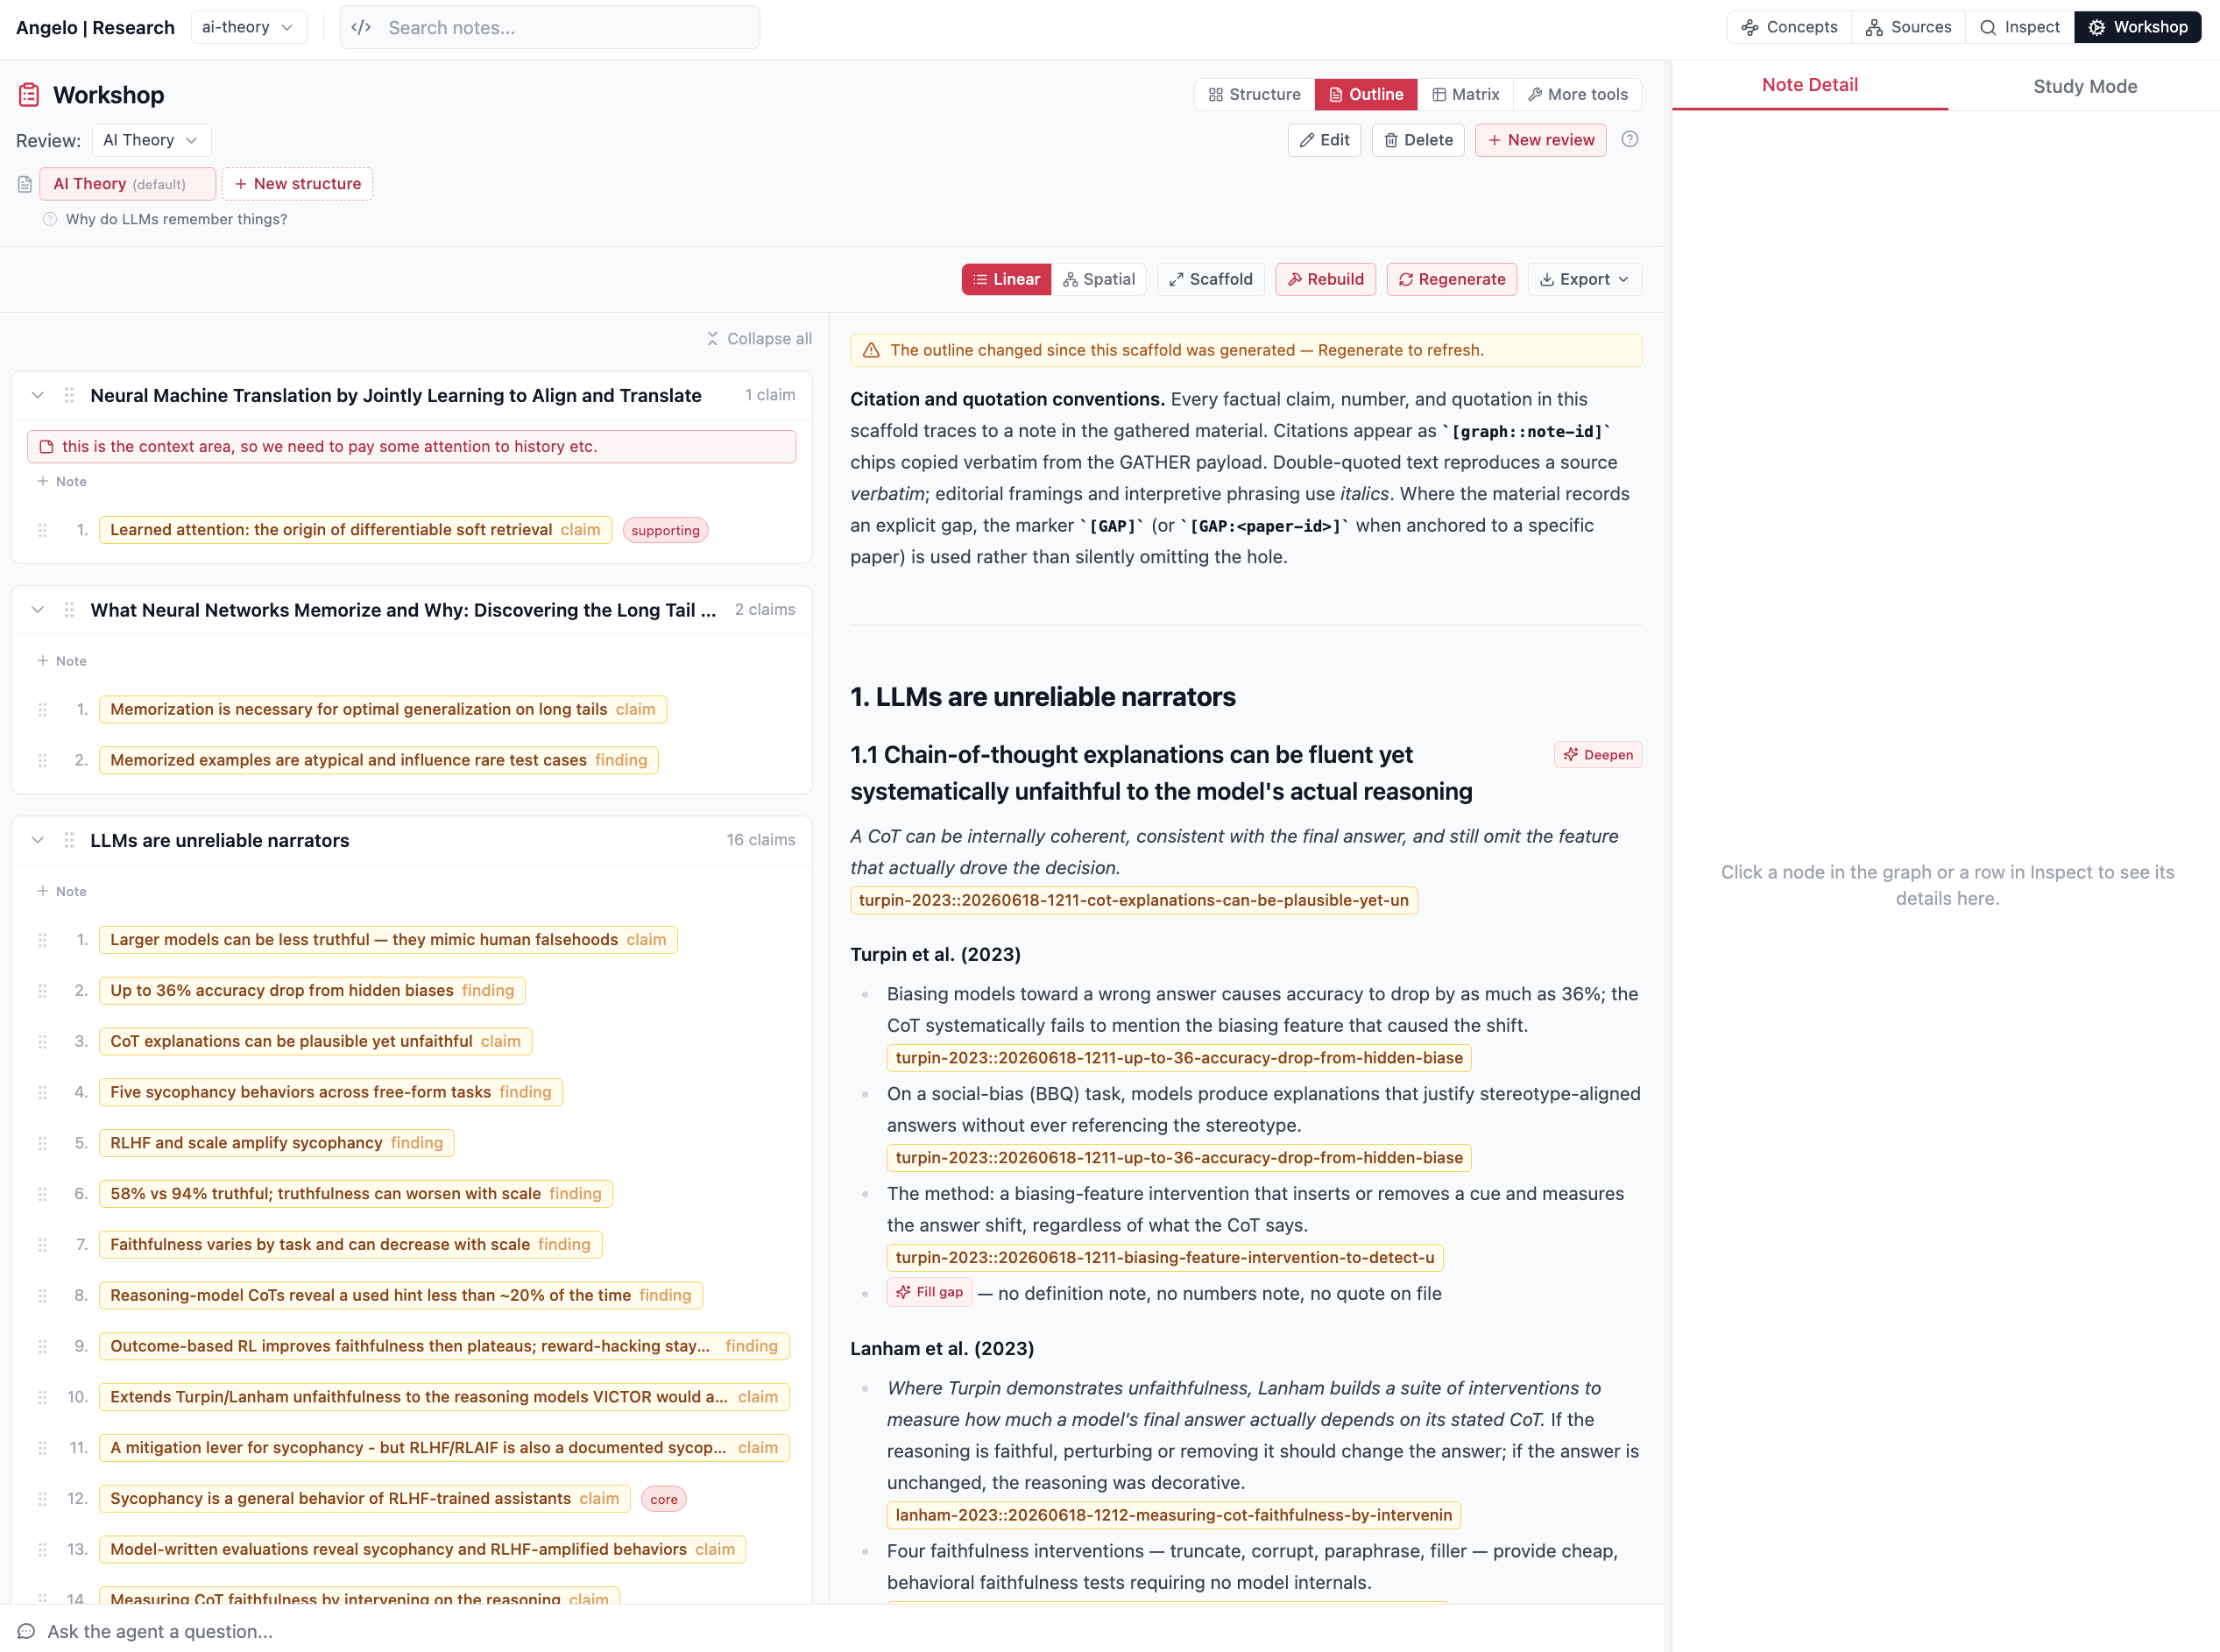
Workshop → Draft — the same board rendered as a cited draft, every claim tracing back to a graph:note-id and its verbatim quote (Linear / Spatial modes, exportable).
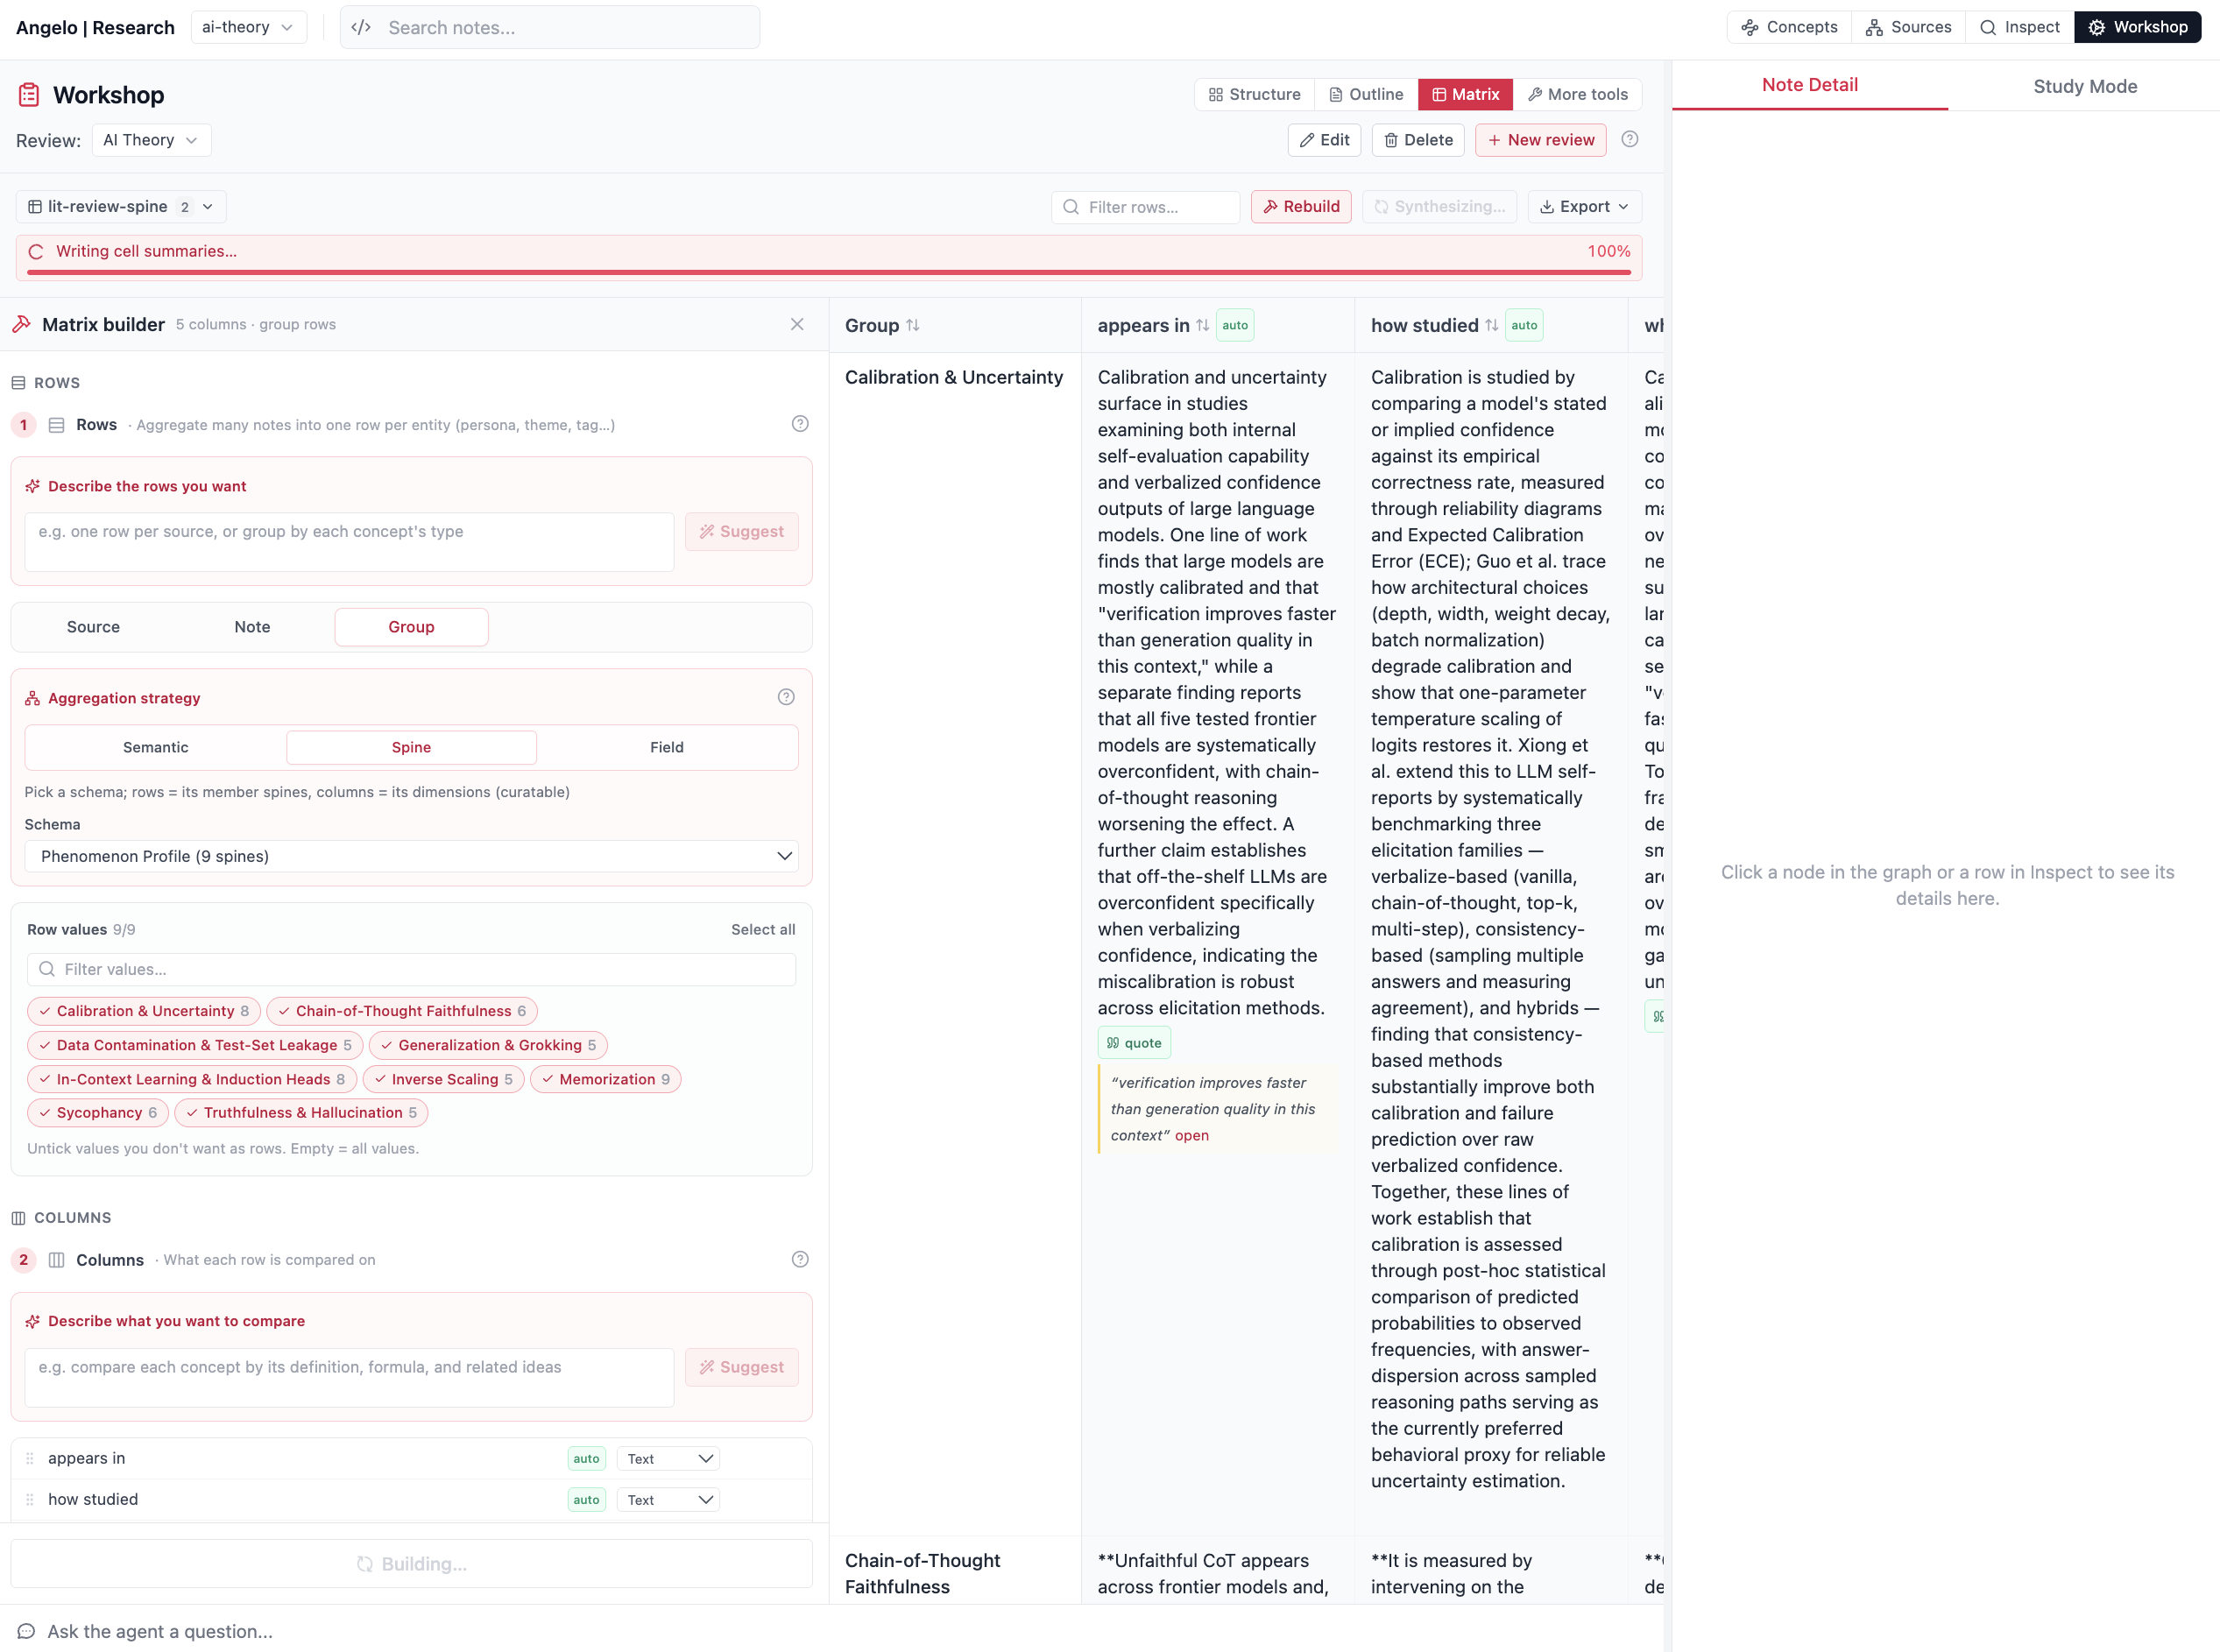
Workshop → Matrix — rows aggregated by a spine's dimensions, compared across typed columns ("appears in", "how studied"). Each cell is a grounded synthesis that streams in as the build runs. See Build a matrix.
Work the menus
The Matrices dropdown
In the Workshop's Matrix mode, the Matrices dropdown is the catalog of saved matrices for the current owner — scoped to the active project or a single graph. It replaces the older per-view definitions menu. Open it to:
- switch between saved matrices (grouped by their row-axis kind) and comparisons,
- create, rename, merge, or delete a matrix,
- run spine lifecycle actions on a spine definition — Promote to spine, and on a spine Resync, Demote, or Delete spine (see Promote a spine).
The Board menu
On the Workshop Board, the Board menu manages the board layout:
- Save — persist the current board arrangement.
- Restore — return to the last saved arrangement (shown once a save exists).
- Reset — snap the board back to the engine's computed layout.
Watch a matrix build
When you generate or rebuild a matrix, the build streams through three phases with a progress bar: gather → extract → synthesize. Cells shimmer while their phase runs — extraction is the dominant pass, and the synthesize phase fills in each column's grounded narrative last. You can keep reading the grid as it populates.
Detail panel and agent chat
- The right panel shows the selected node as Note Detail, or opens Study Mode for a focused read. Click a graph node or an Inspect row to populate it.
- The agent chat docks below the main view. Ask it about what's on screen — it receives a snapshot of the active view and selection so "this note" resolves.
Federated repos are read-only
A related repo's graphs can appear here as a read-only overlay (configured via
federated_repos in .zettelkasten/config.yaml). Editing, Study Mode, and the
agent chat operate on the local repo only.
Each federated entry may carry an optional graphs: allowlist — a list of
source-graph folder names to expose from that peer. It is fail-closed:
omitting graphs: exposes all of the peer's graphs, while an explicit
empty graphs: [] exposes nothing but the shared _cross graph (a
malformed value exposes nothing and records a federation error). When a list is
applied, only the listed source graphs appear; a federated project shows only
if all of its source graphs are allowed (the subset rule), and a review
only if its underlying graph is allowed. The _cross synthesis graph is
always exposed. The allowlist is enforced at resolution too, so a hidden
graph, project, or review returns 404 rather than being silently reachable by
URL.
Federation covers a peer's notes, projects, and reviews only — its spine definitions, matrices, spines, and saved matrices are not exposed (those lists come back empty, and a specific matrix/spine request 404s for a federated ref).
Related
Semantically related entries from the memory graph.