Use the memory dashboard
Launch the memory dashboard and use it to browse the research tree, the skills library, sessions, experiment runs, and live coordinator runs. For how this UI is built and what each subtab is for, see Dashboard.
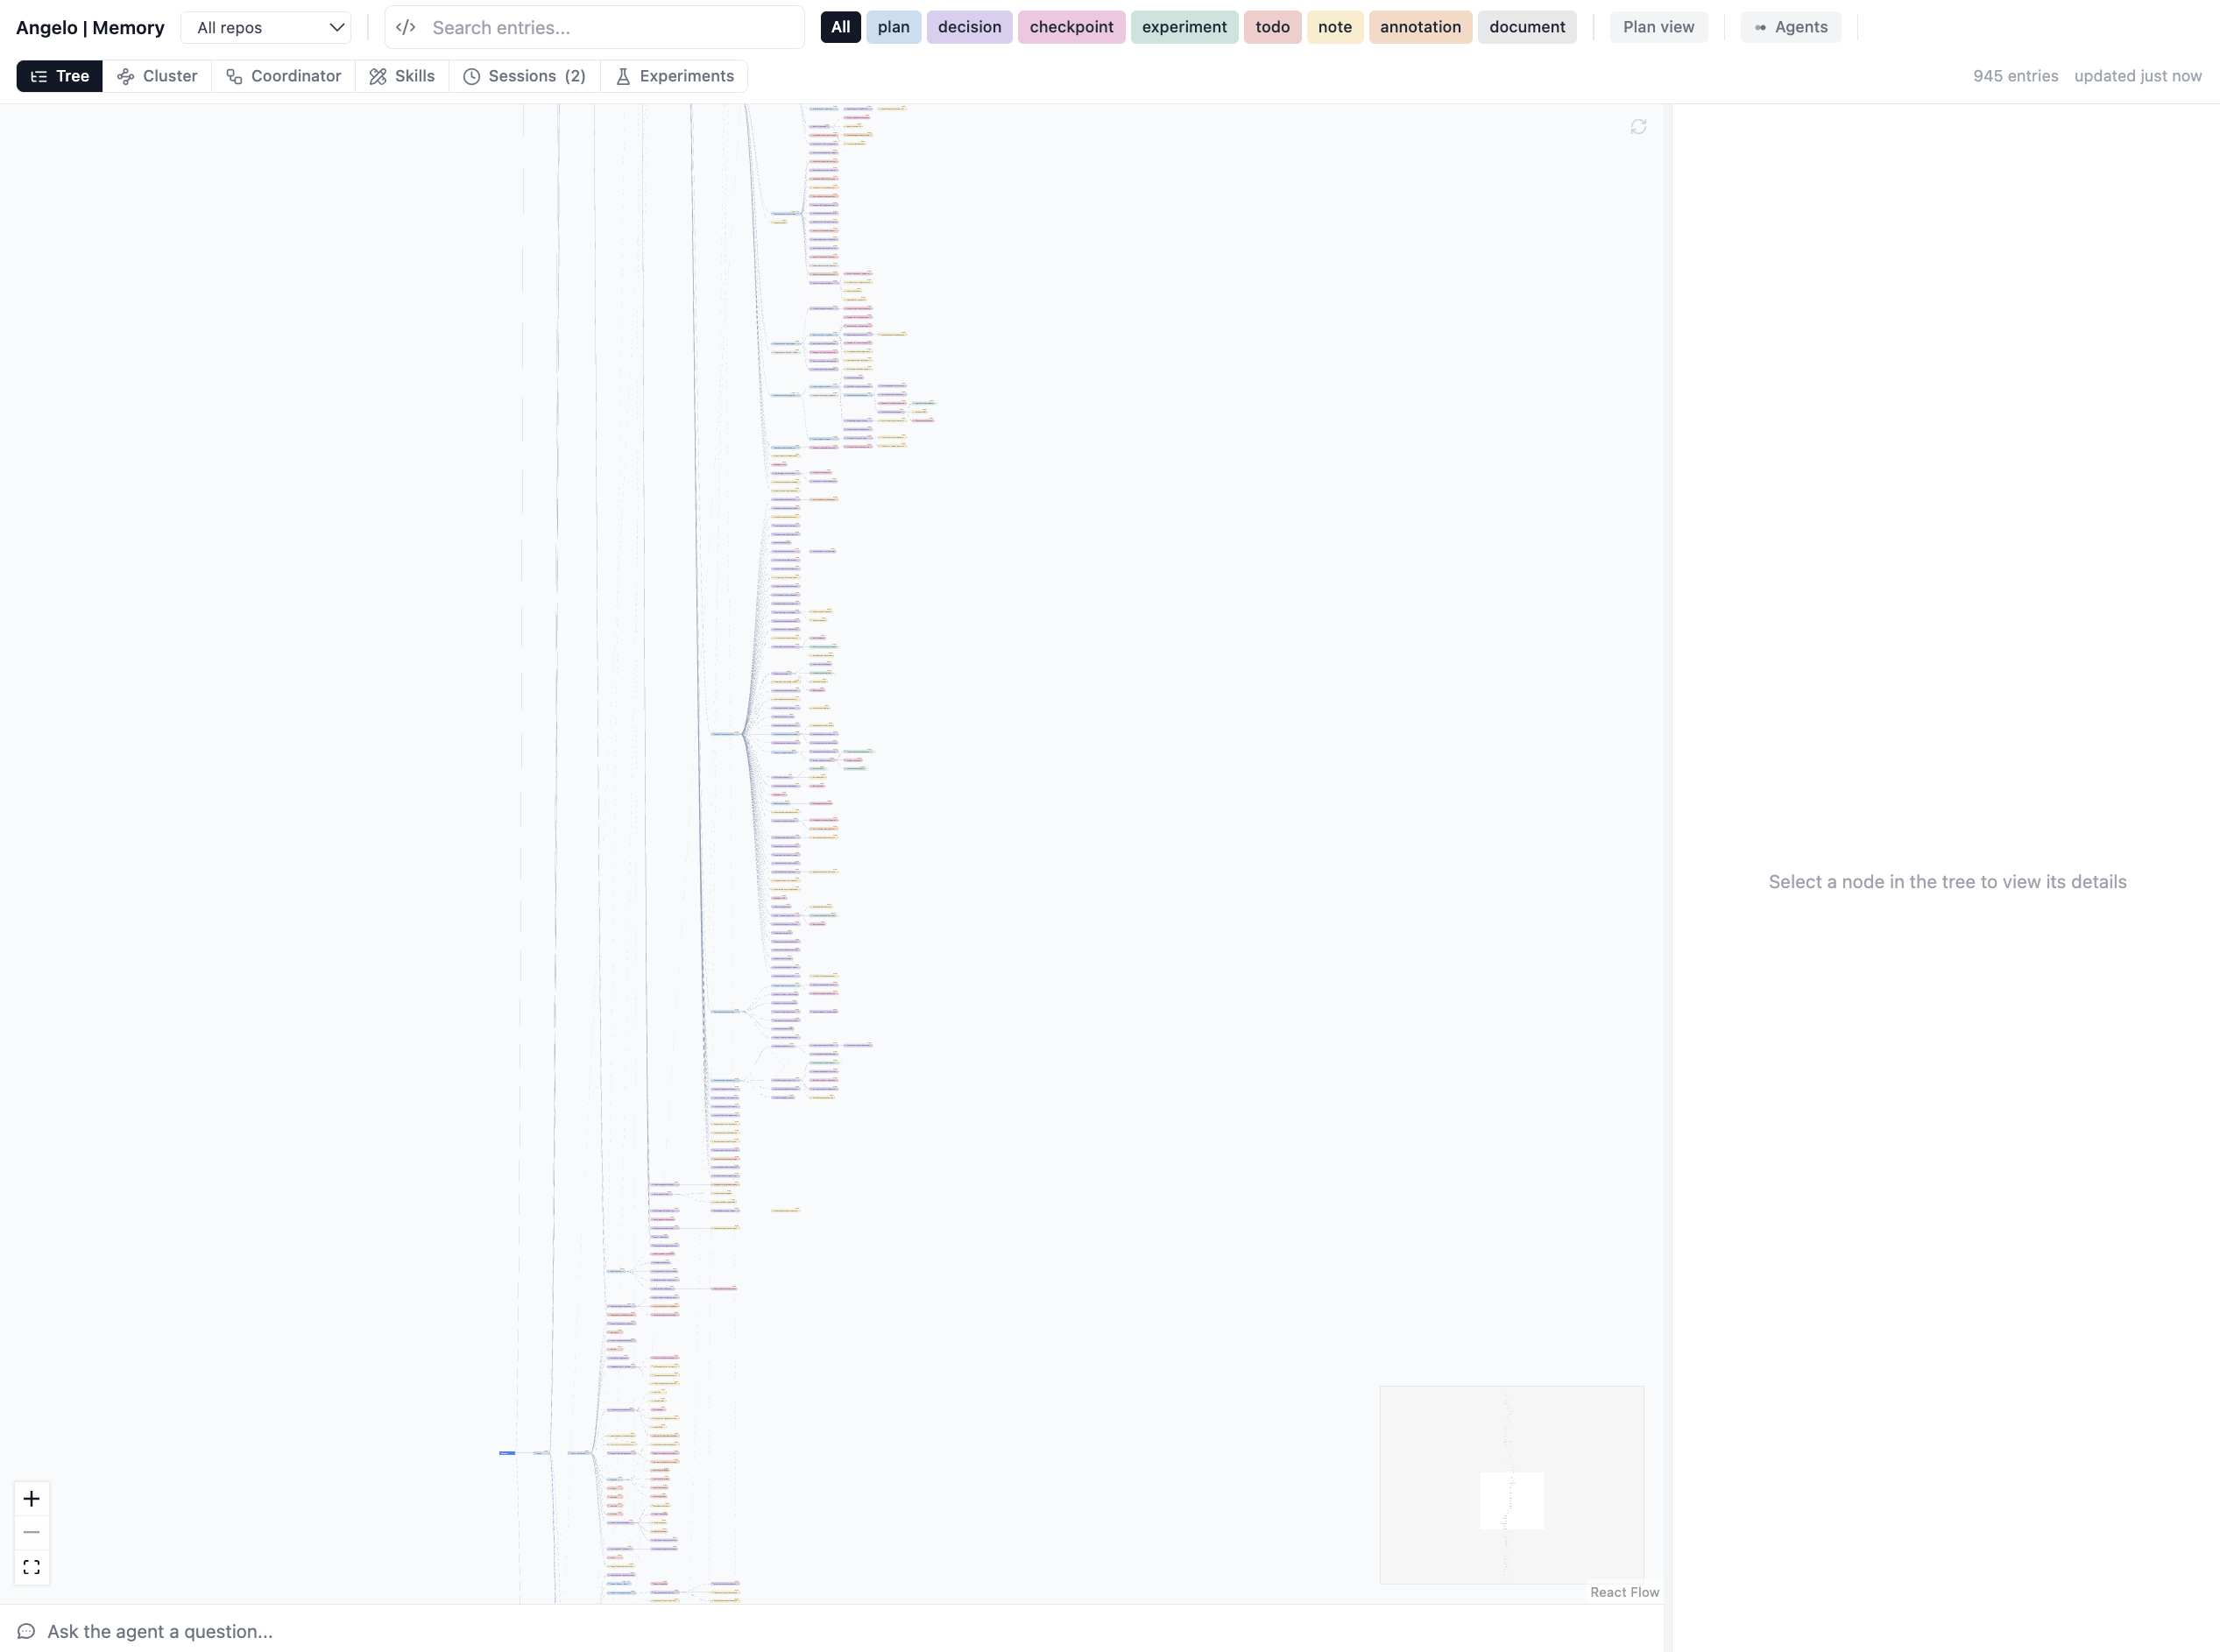
The Tree view: browse the whole research tree, filter by entry type, and click a node to inspect it in the side panel.
This is the memory dashboard only
This page covers the research-tree/sessions UI (console script
angelo-dashboard). The zettelkasten corpus explorer is a separate app — see
Use the zettelkasten dashboard.
Launch it
From a chat, call the memory MCP's launch_dashboard tool, or run the console
script directly:
It returns a local URL. The dashboard reads .memory/ directly (plus live session
sidecars under .memory/active-sessions/) — it never owns state it could lose, so
deleting its cache costs nothing. The chat sidecar runs in-process via cursor-sdk's
local runtime, so no system Node.js is required for the core UI.
Tour the tabs
The view switcher sits in the toolbar. Each subtab is a different lens over the
same .memory/ backend:
- Tree / clusters — the research tree and its semantic clusters. See Tree and clusters.
- Skills — the reusable procedures
agents save with
skill(action='save'); browse, read, and prune them here. - Sessions — live session cards (from running MCP processes' heartbeat sidecars) alongside finalized session history from the committed tree. A card is marked stale once its heartbeat ages out or its process is gone.
- Experiments — experiment provenance: DVC-backed manifests joined with their memory entries, split from lighter-weight tests. See Run experiments.
- Execution monitor — a live view of any in-flight coordinator run, drawn at the tree node where the run records its output.
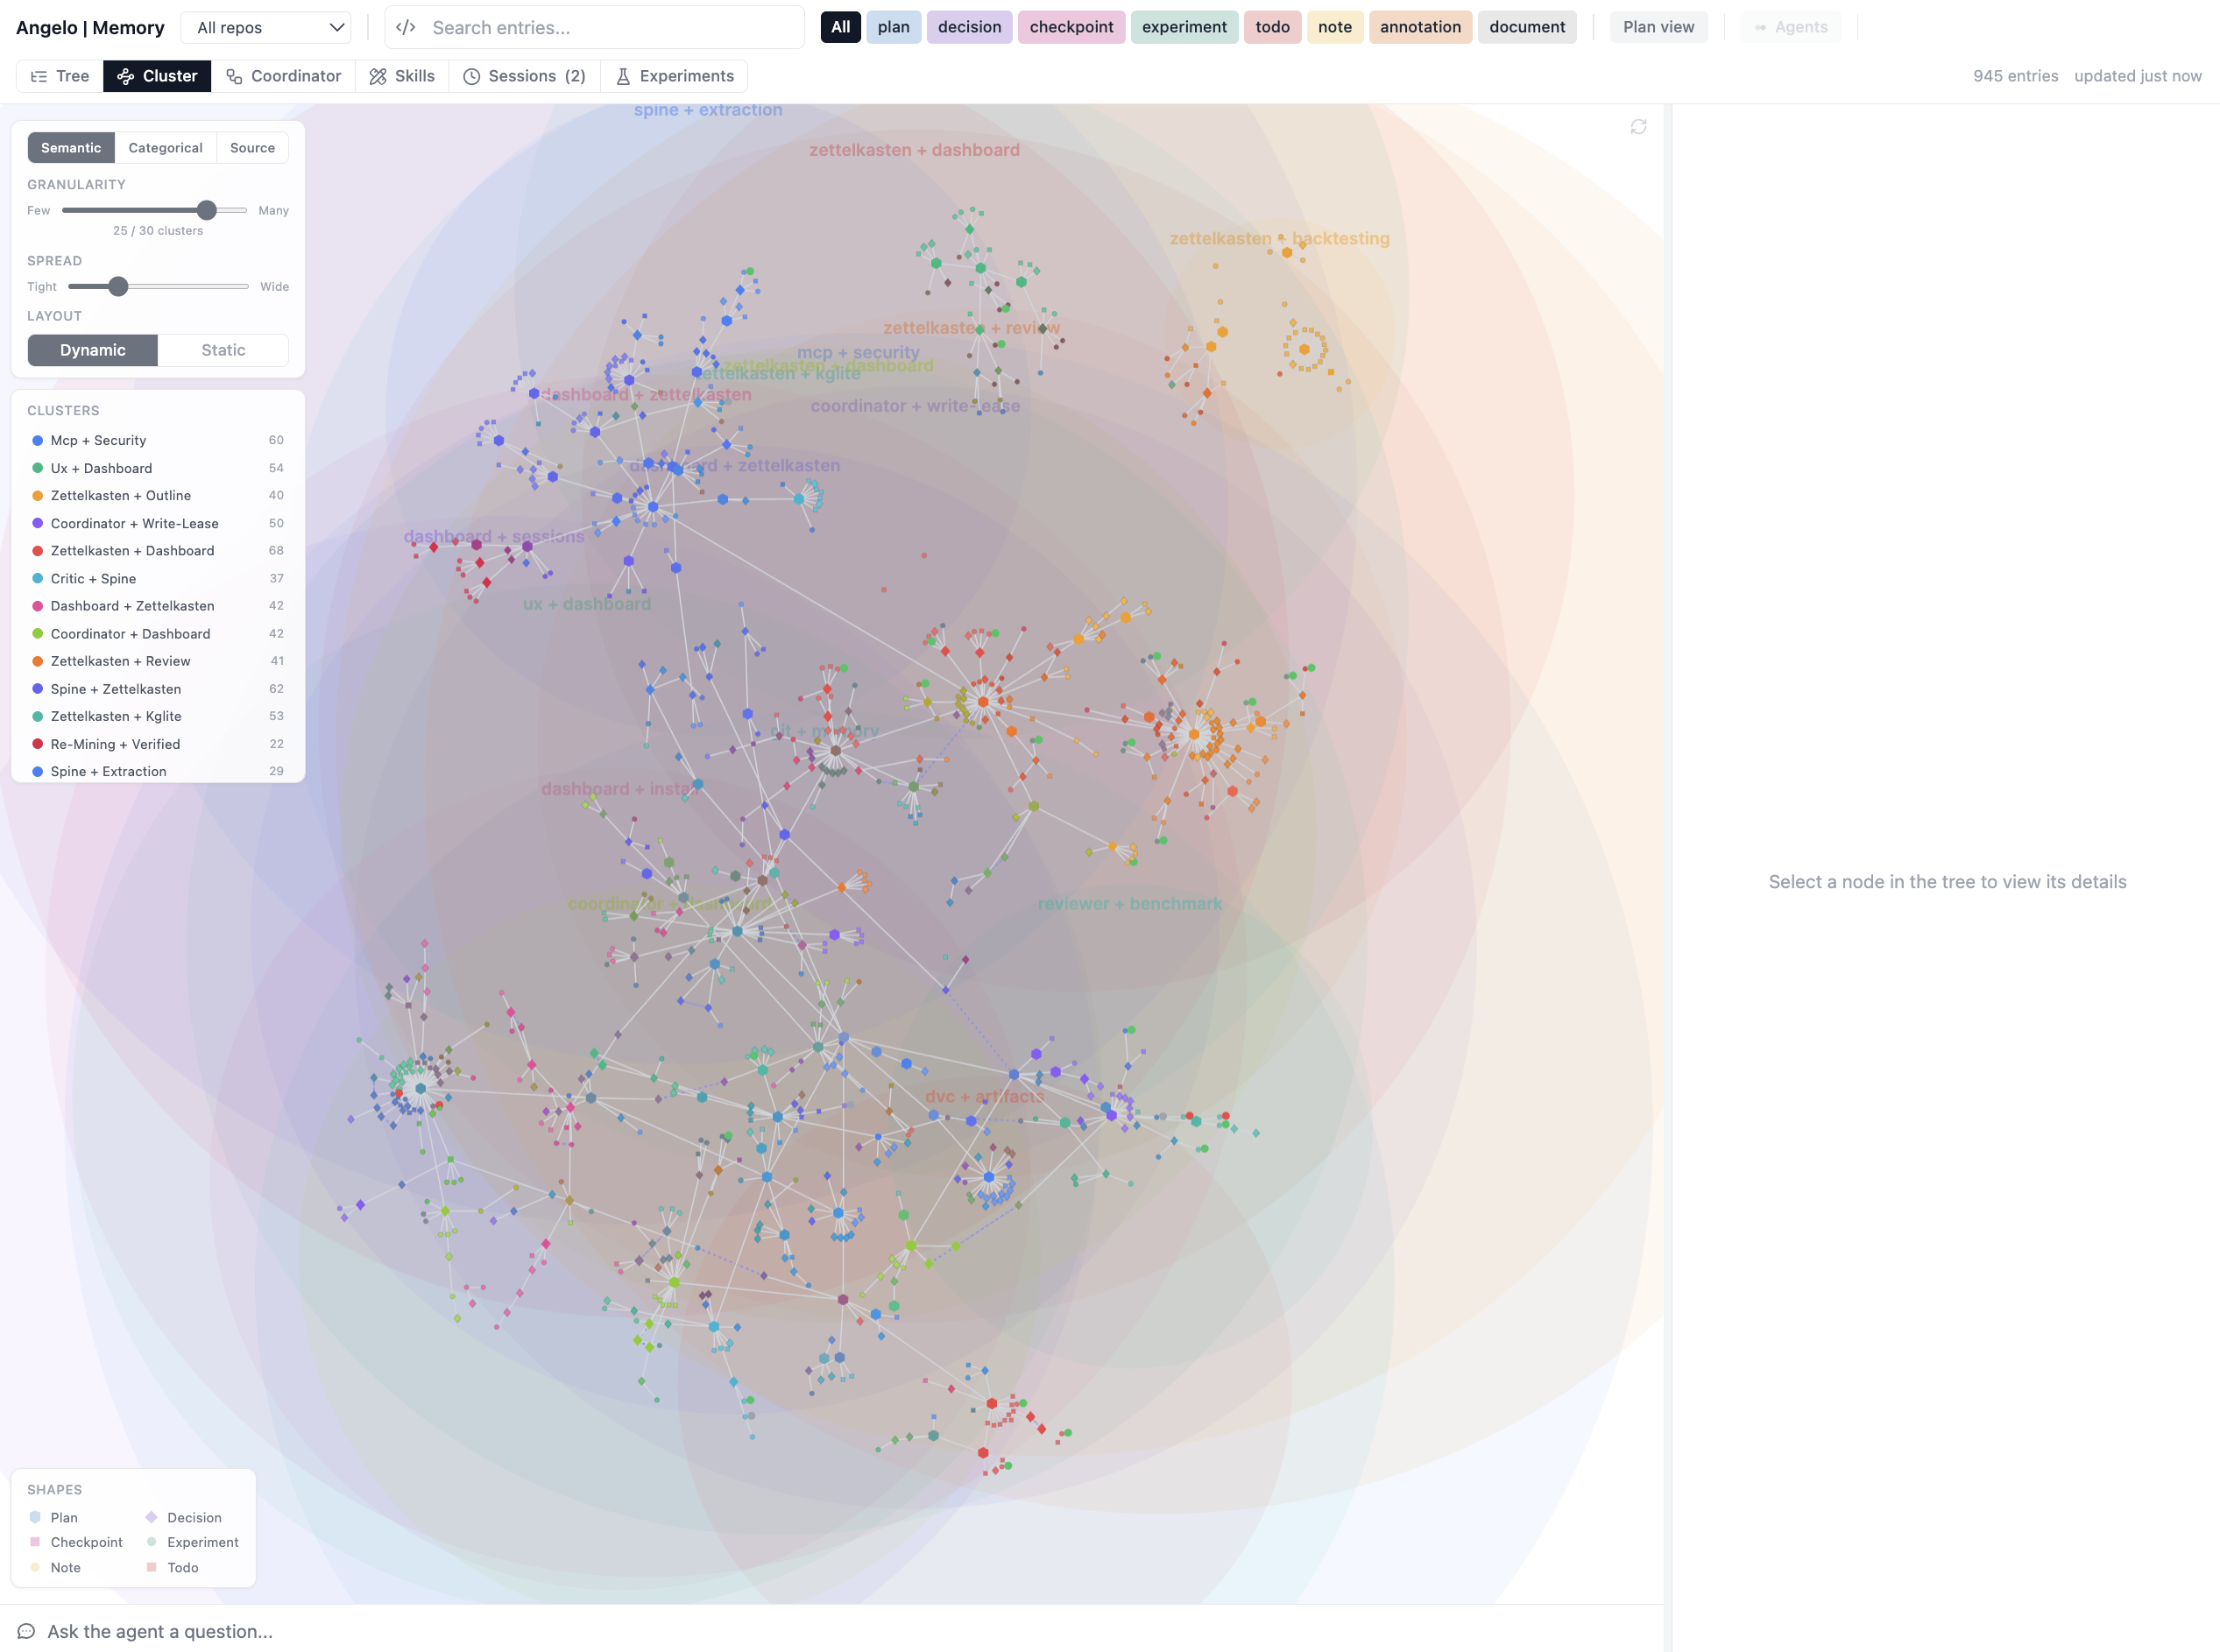
The Cluster tab regroups the same entries by meaning — see Tree and clusters for how the two projections differ.
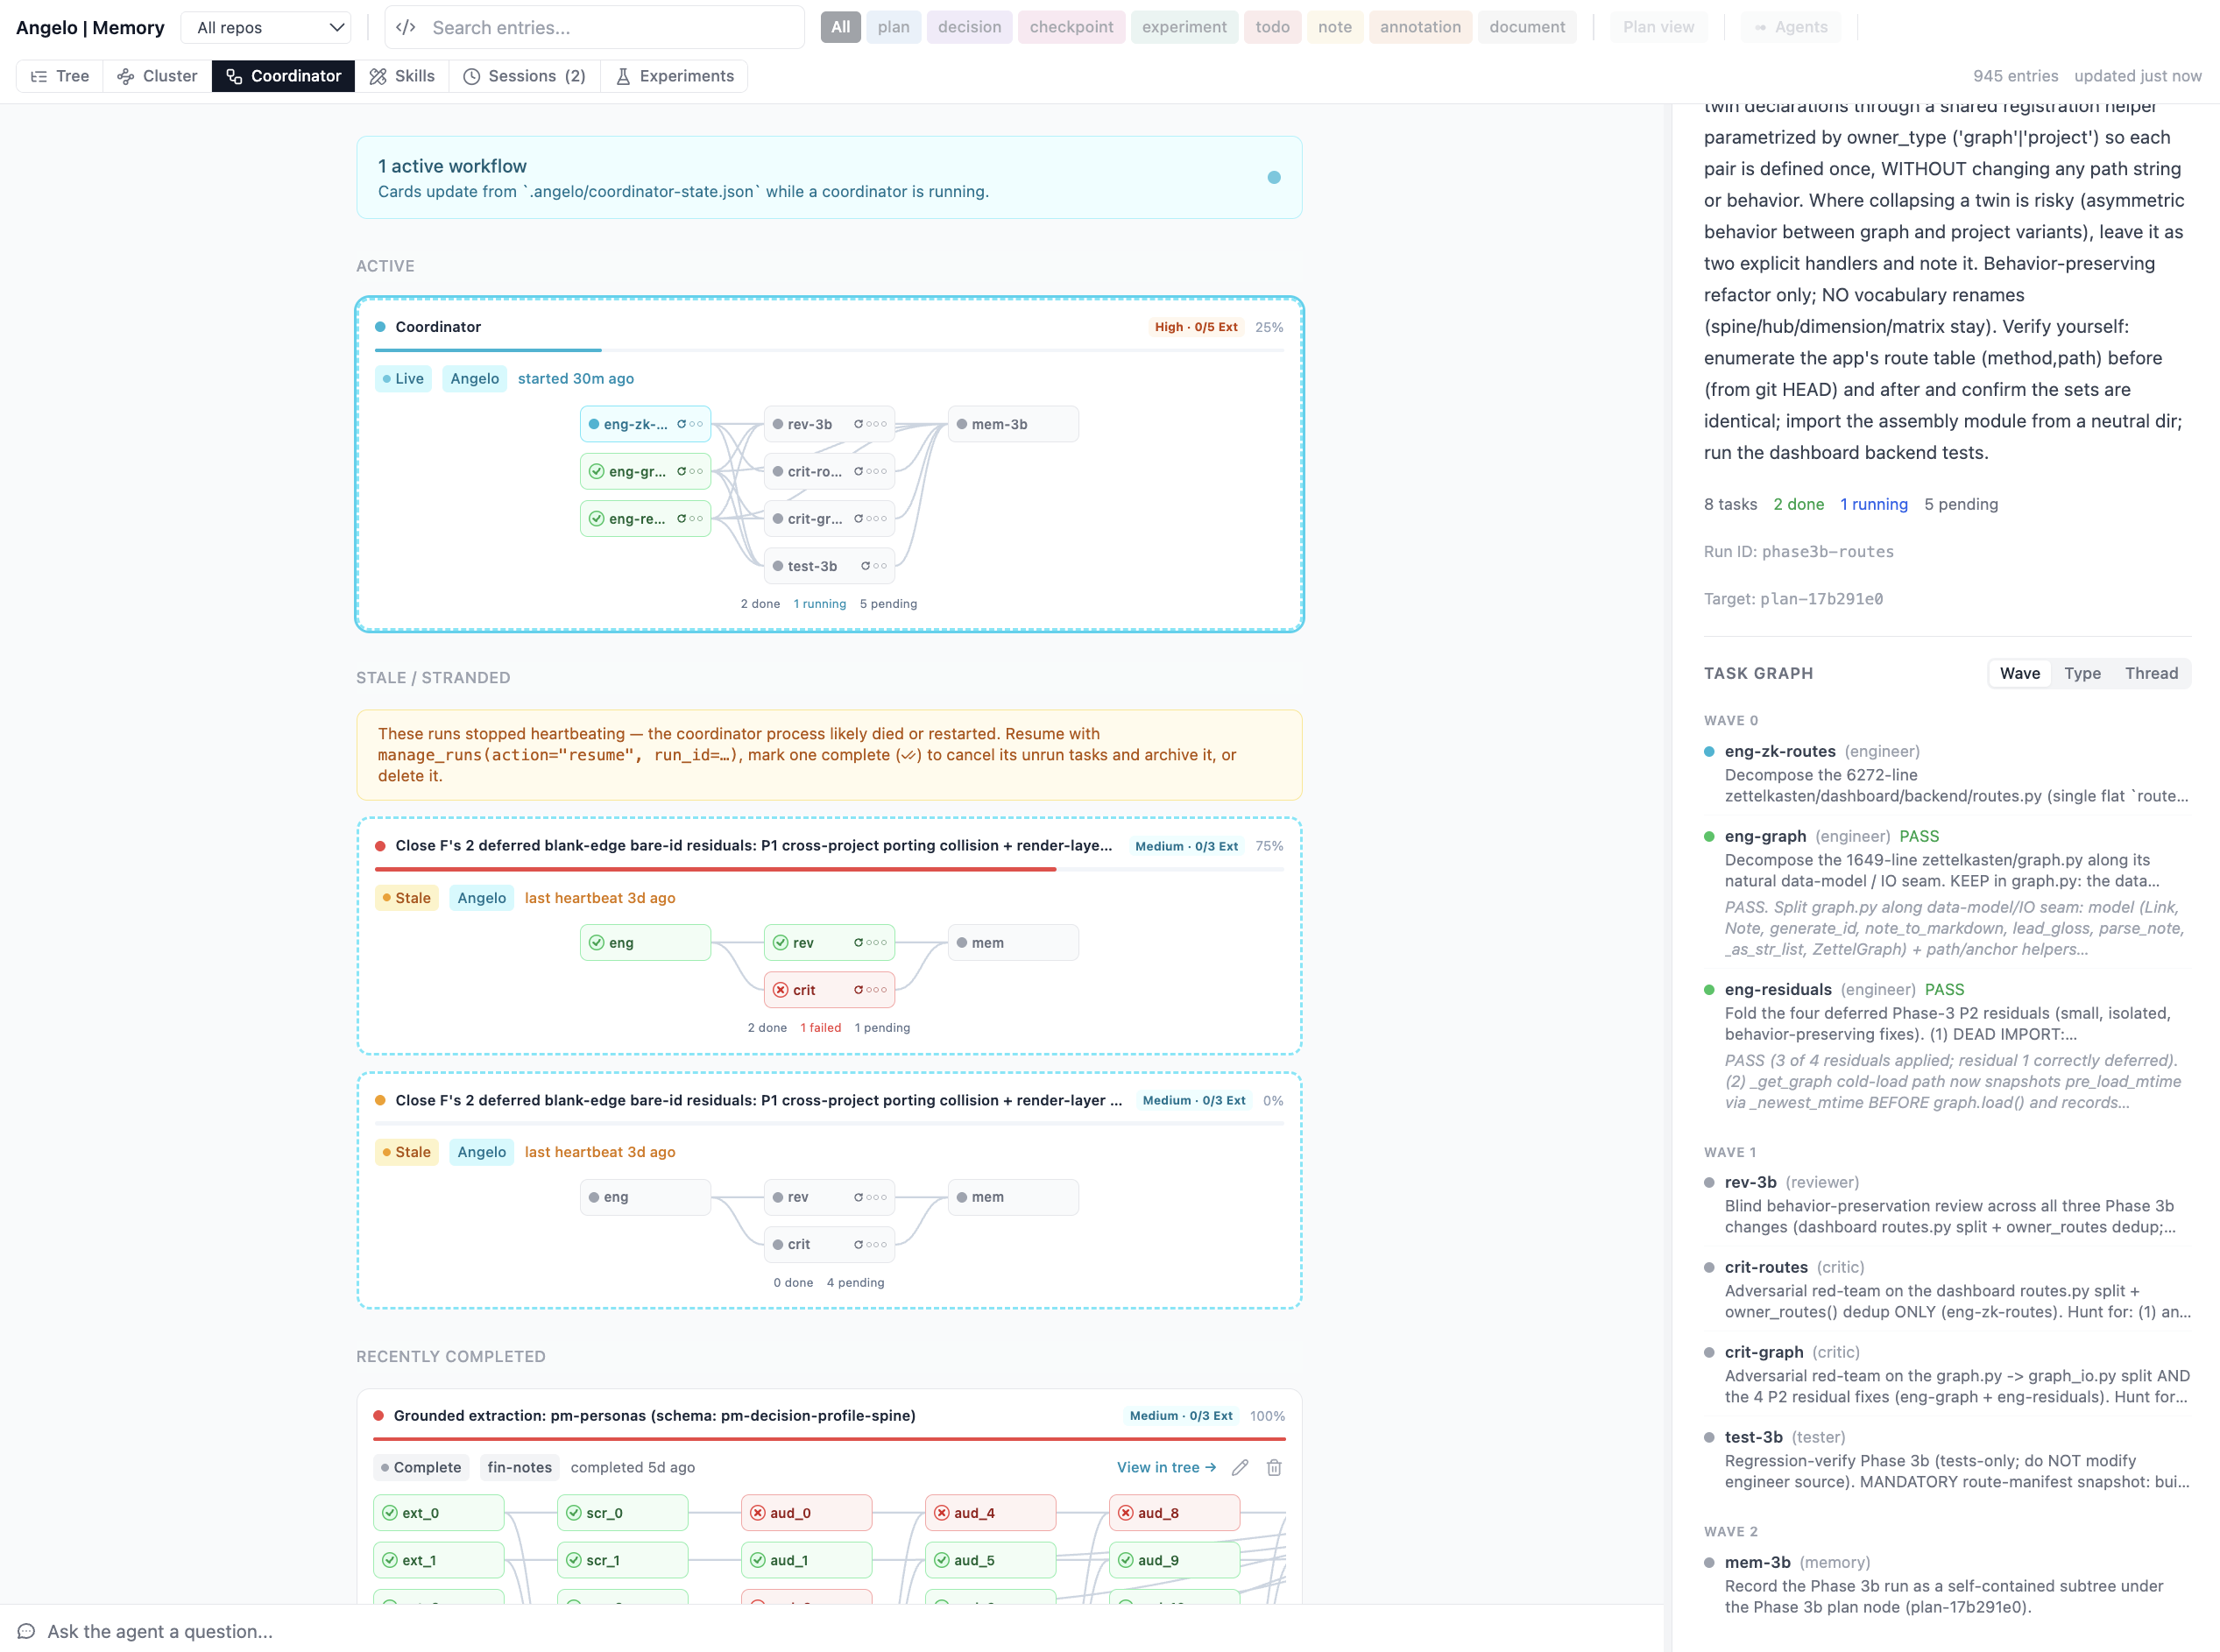
The Coordinator tab is a live execution monitor for coordinator runs — active, stale, and completed.
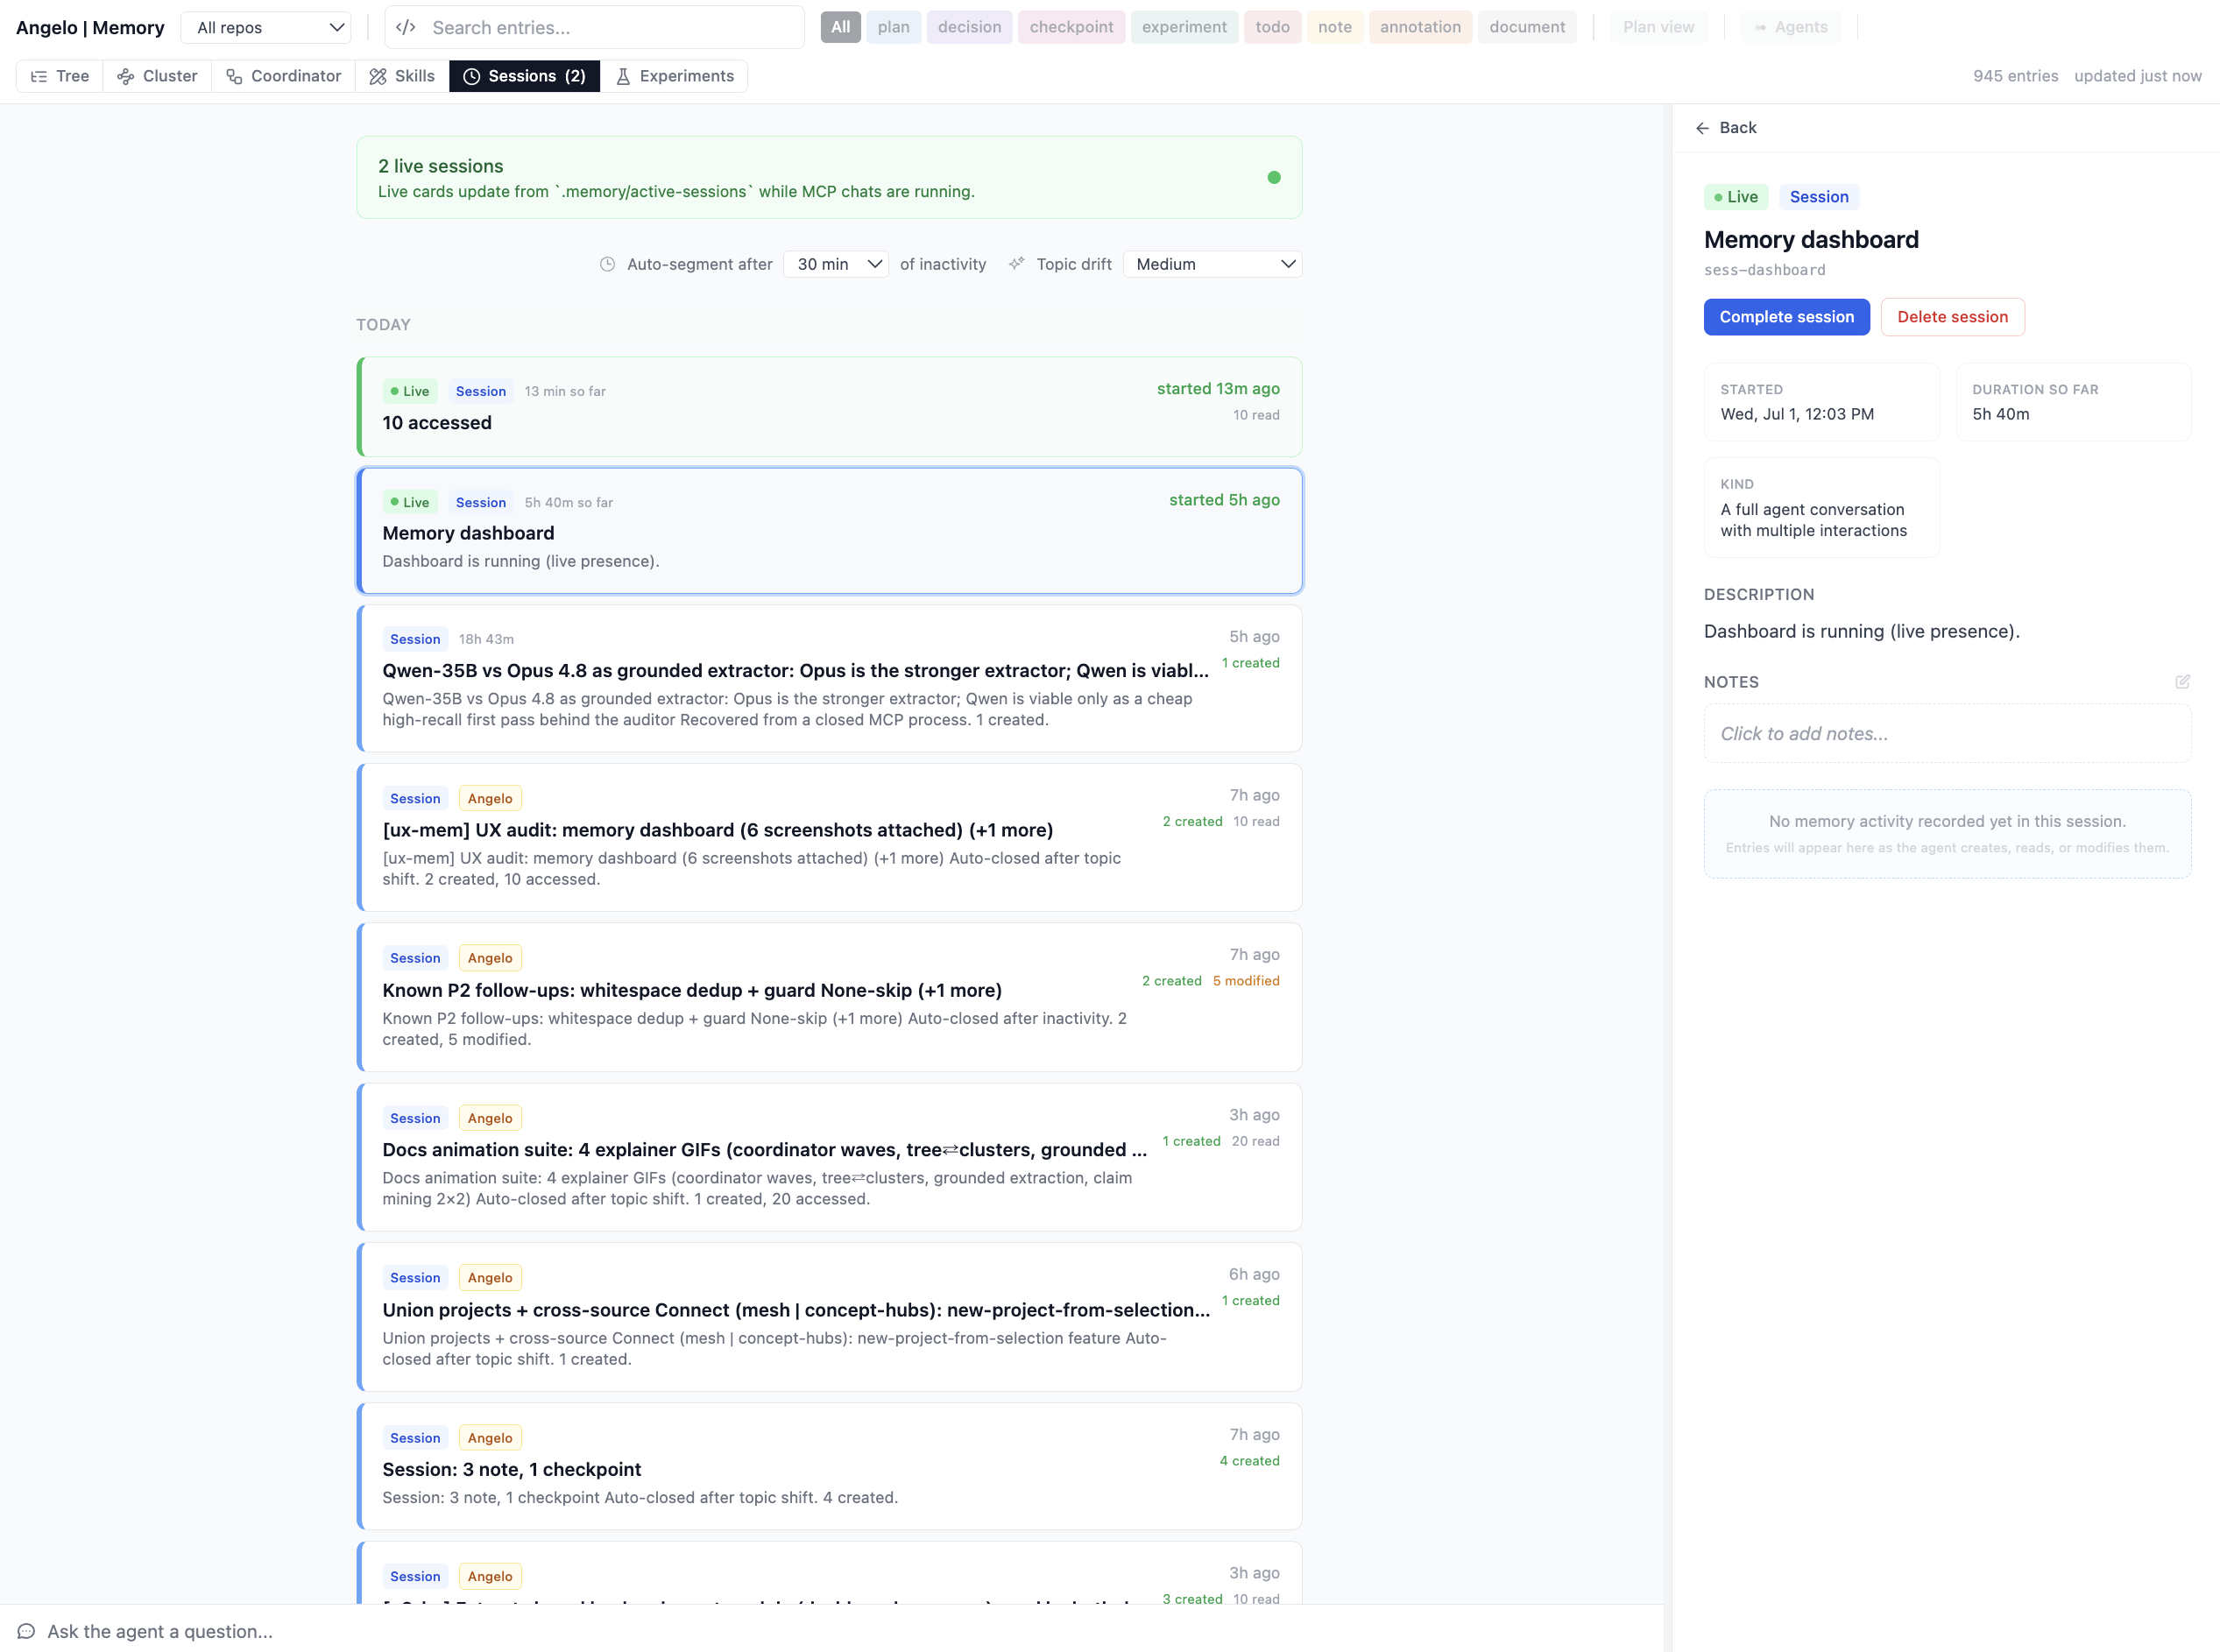
The Sessions tab — live cards from running MCP chats (green) alongside finalized session history, each with what it created/read/modified.
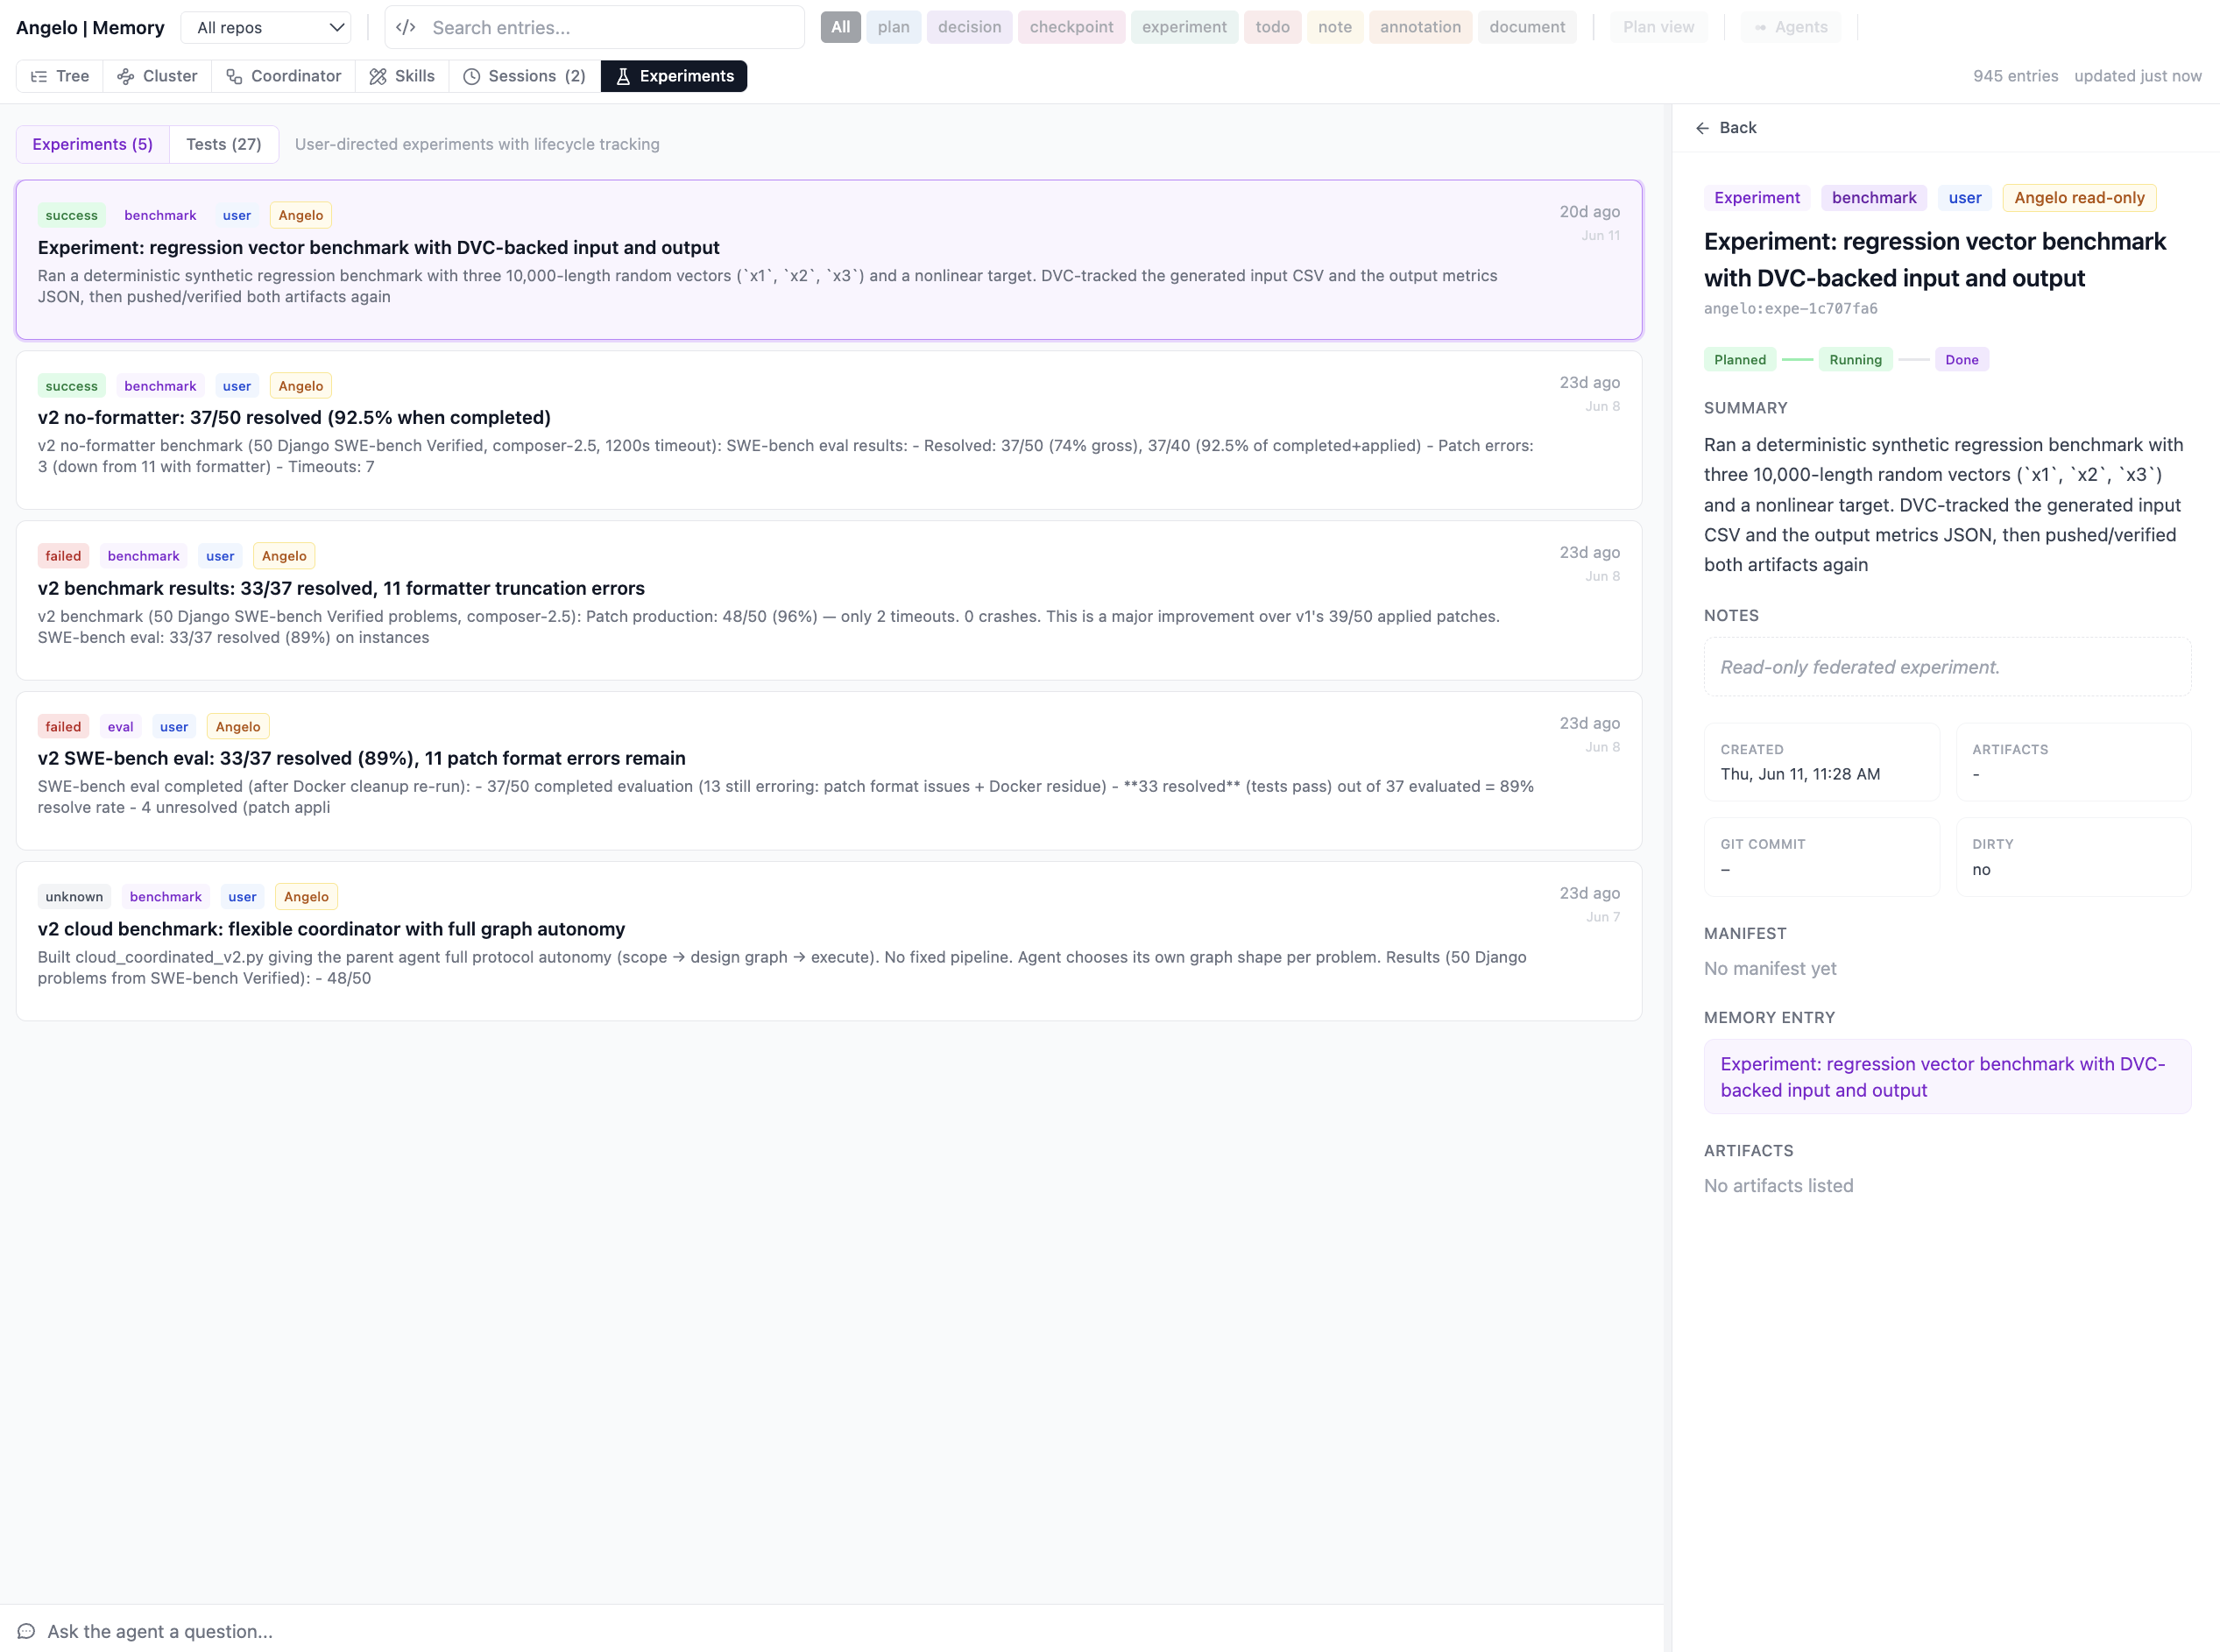
The Experiments tab — DVC-backed experiment manifests and test runs; see Experiments and AWS.
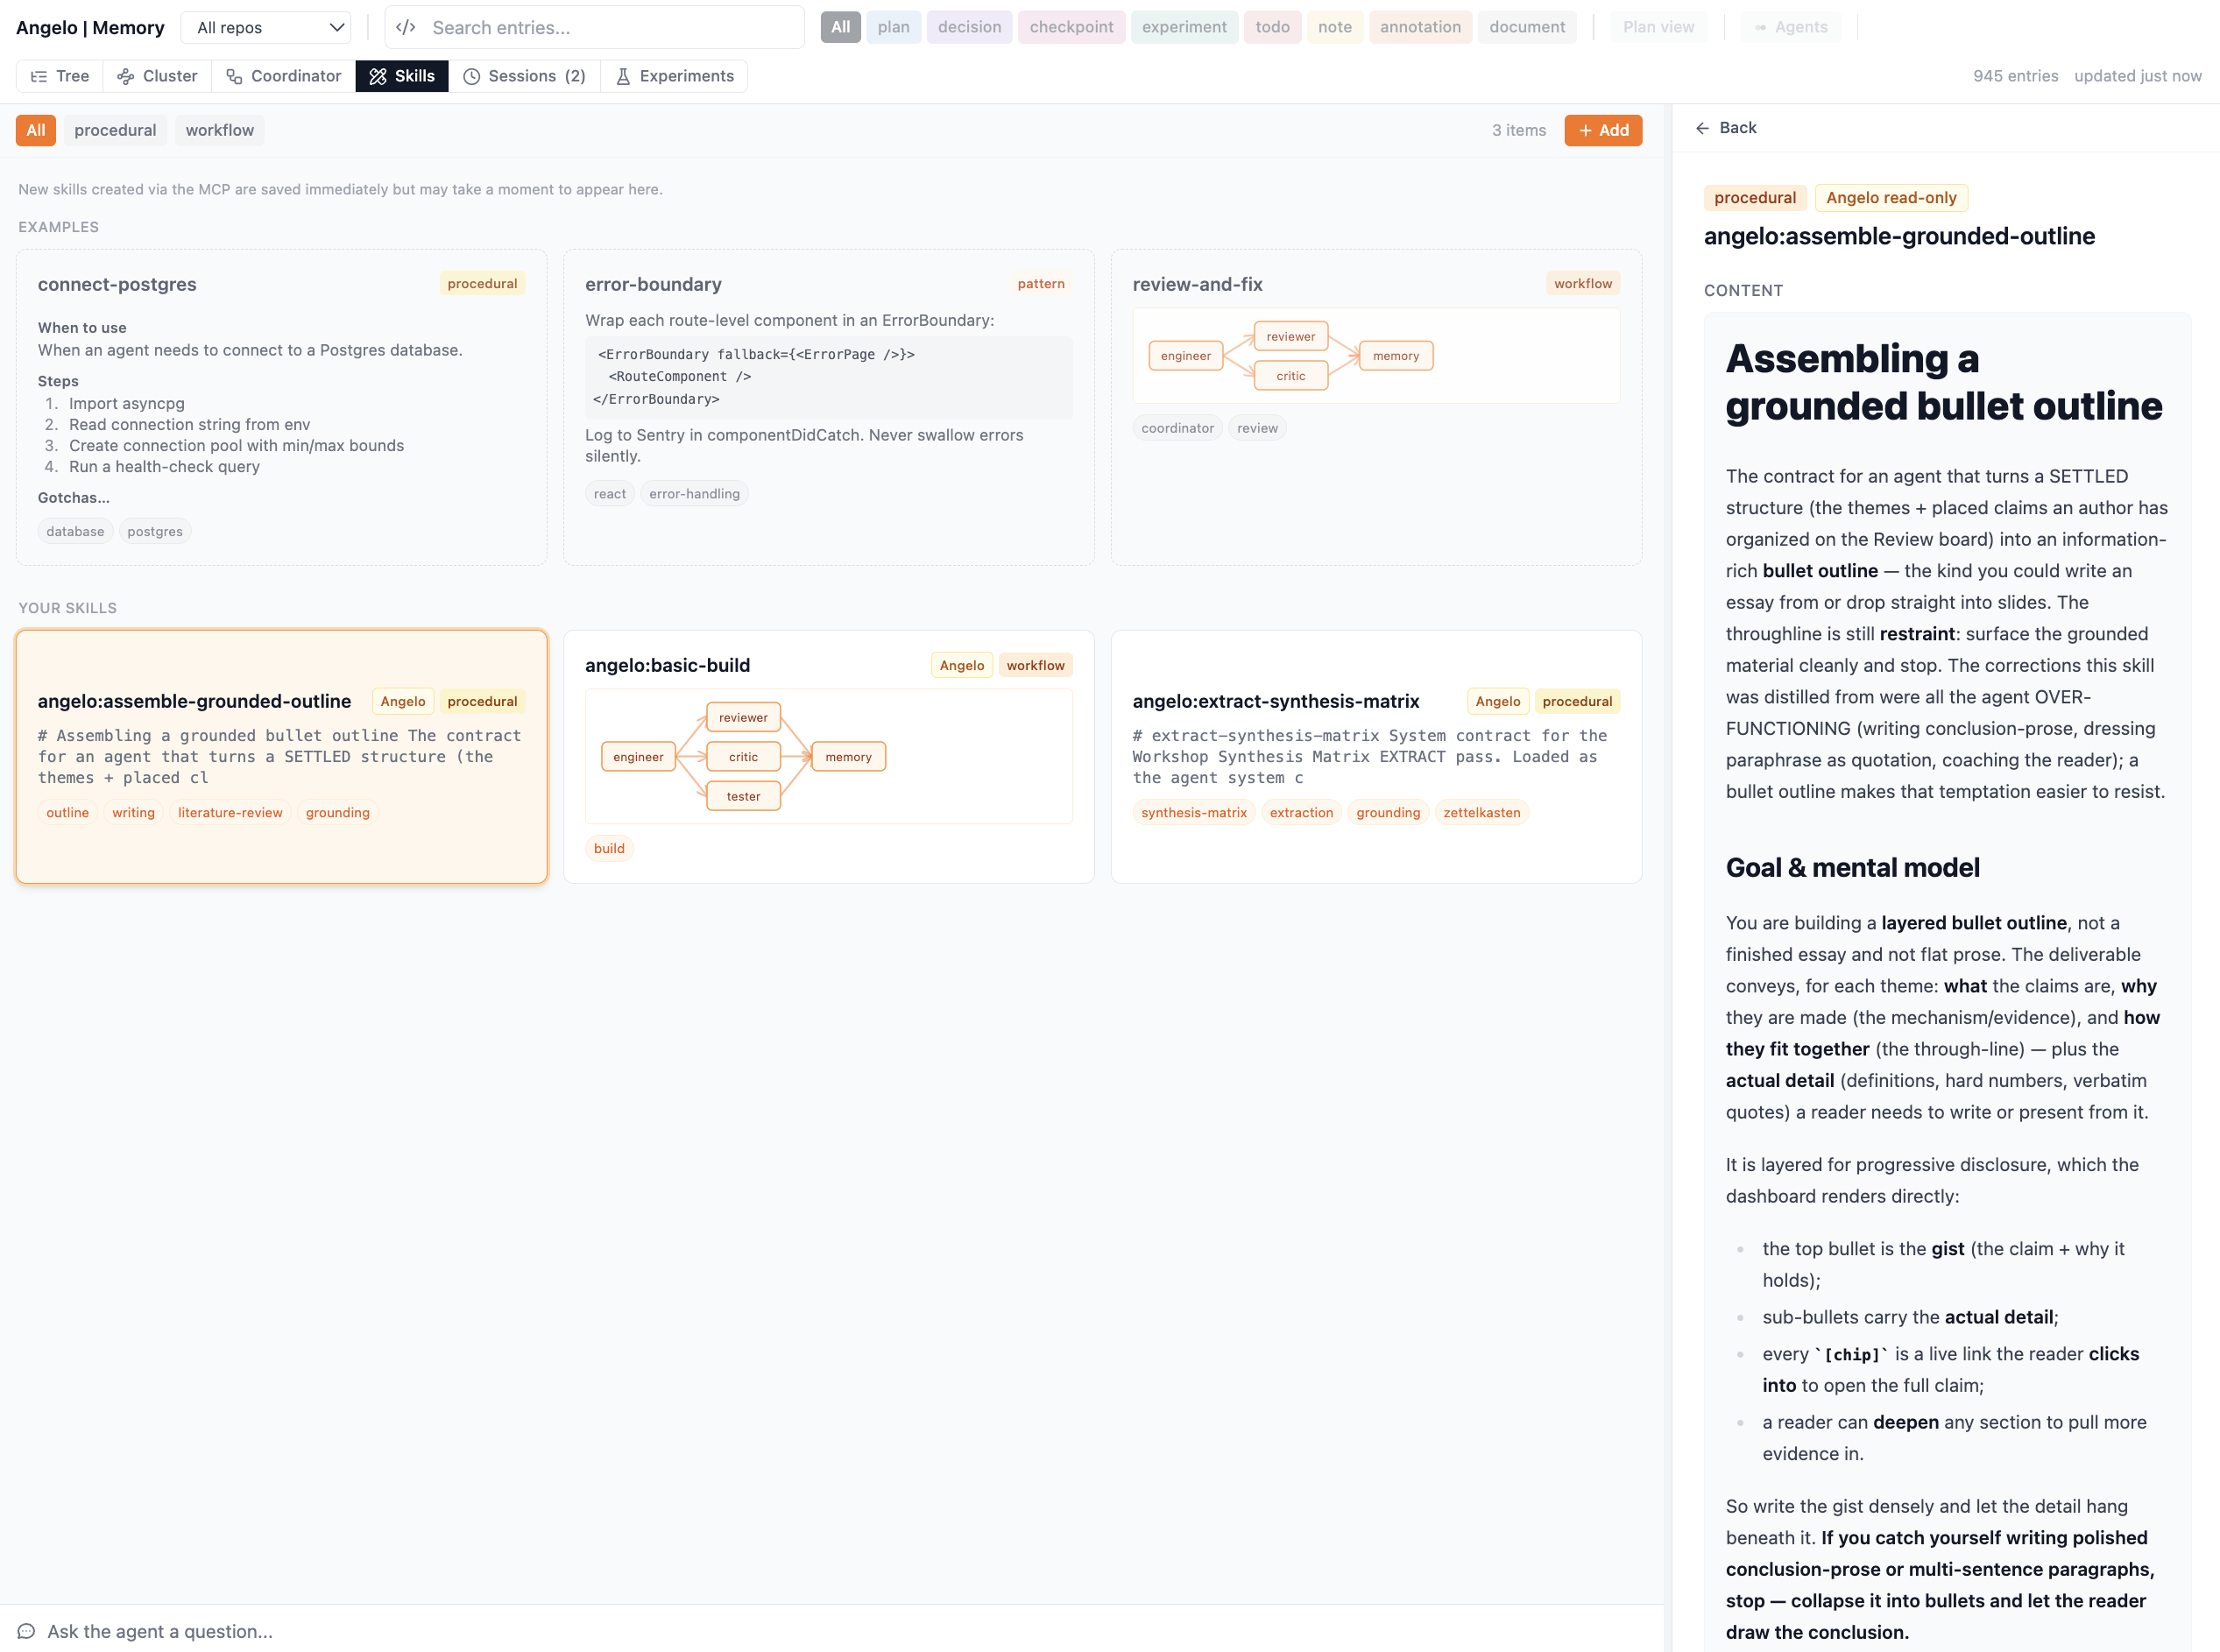
The Skills tab — the reusable procedures agents save with skill(action='save'), split into procedural, pattern, and workflow types.
If a live session card is missing
Restart the MCP server (or Cursor) so the latest memory server writes sidecars,
then call health() to confirm cache freshness and git state.
Federated repos
Another repo's tree can be browsed alongside this one as a read-only overlay,
configured via federated_repos in .memory/config.yaml.
Related
Semantically related entries from the memory graph.