Dashboard
The memory dashboard is a read-mostly web UI for looking at the knowledge angelo
has accumulated: the research tree, the skills library, what past and current
sessions did, experiment provenance, and live coordinator runs. It is a lens over
.memory/, not a second source of truth.
This page explains how that lens is built and what each subtab is for. To actually launch it, see the how-to: Use the memory dashboard.
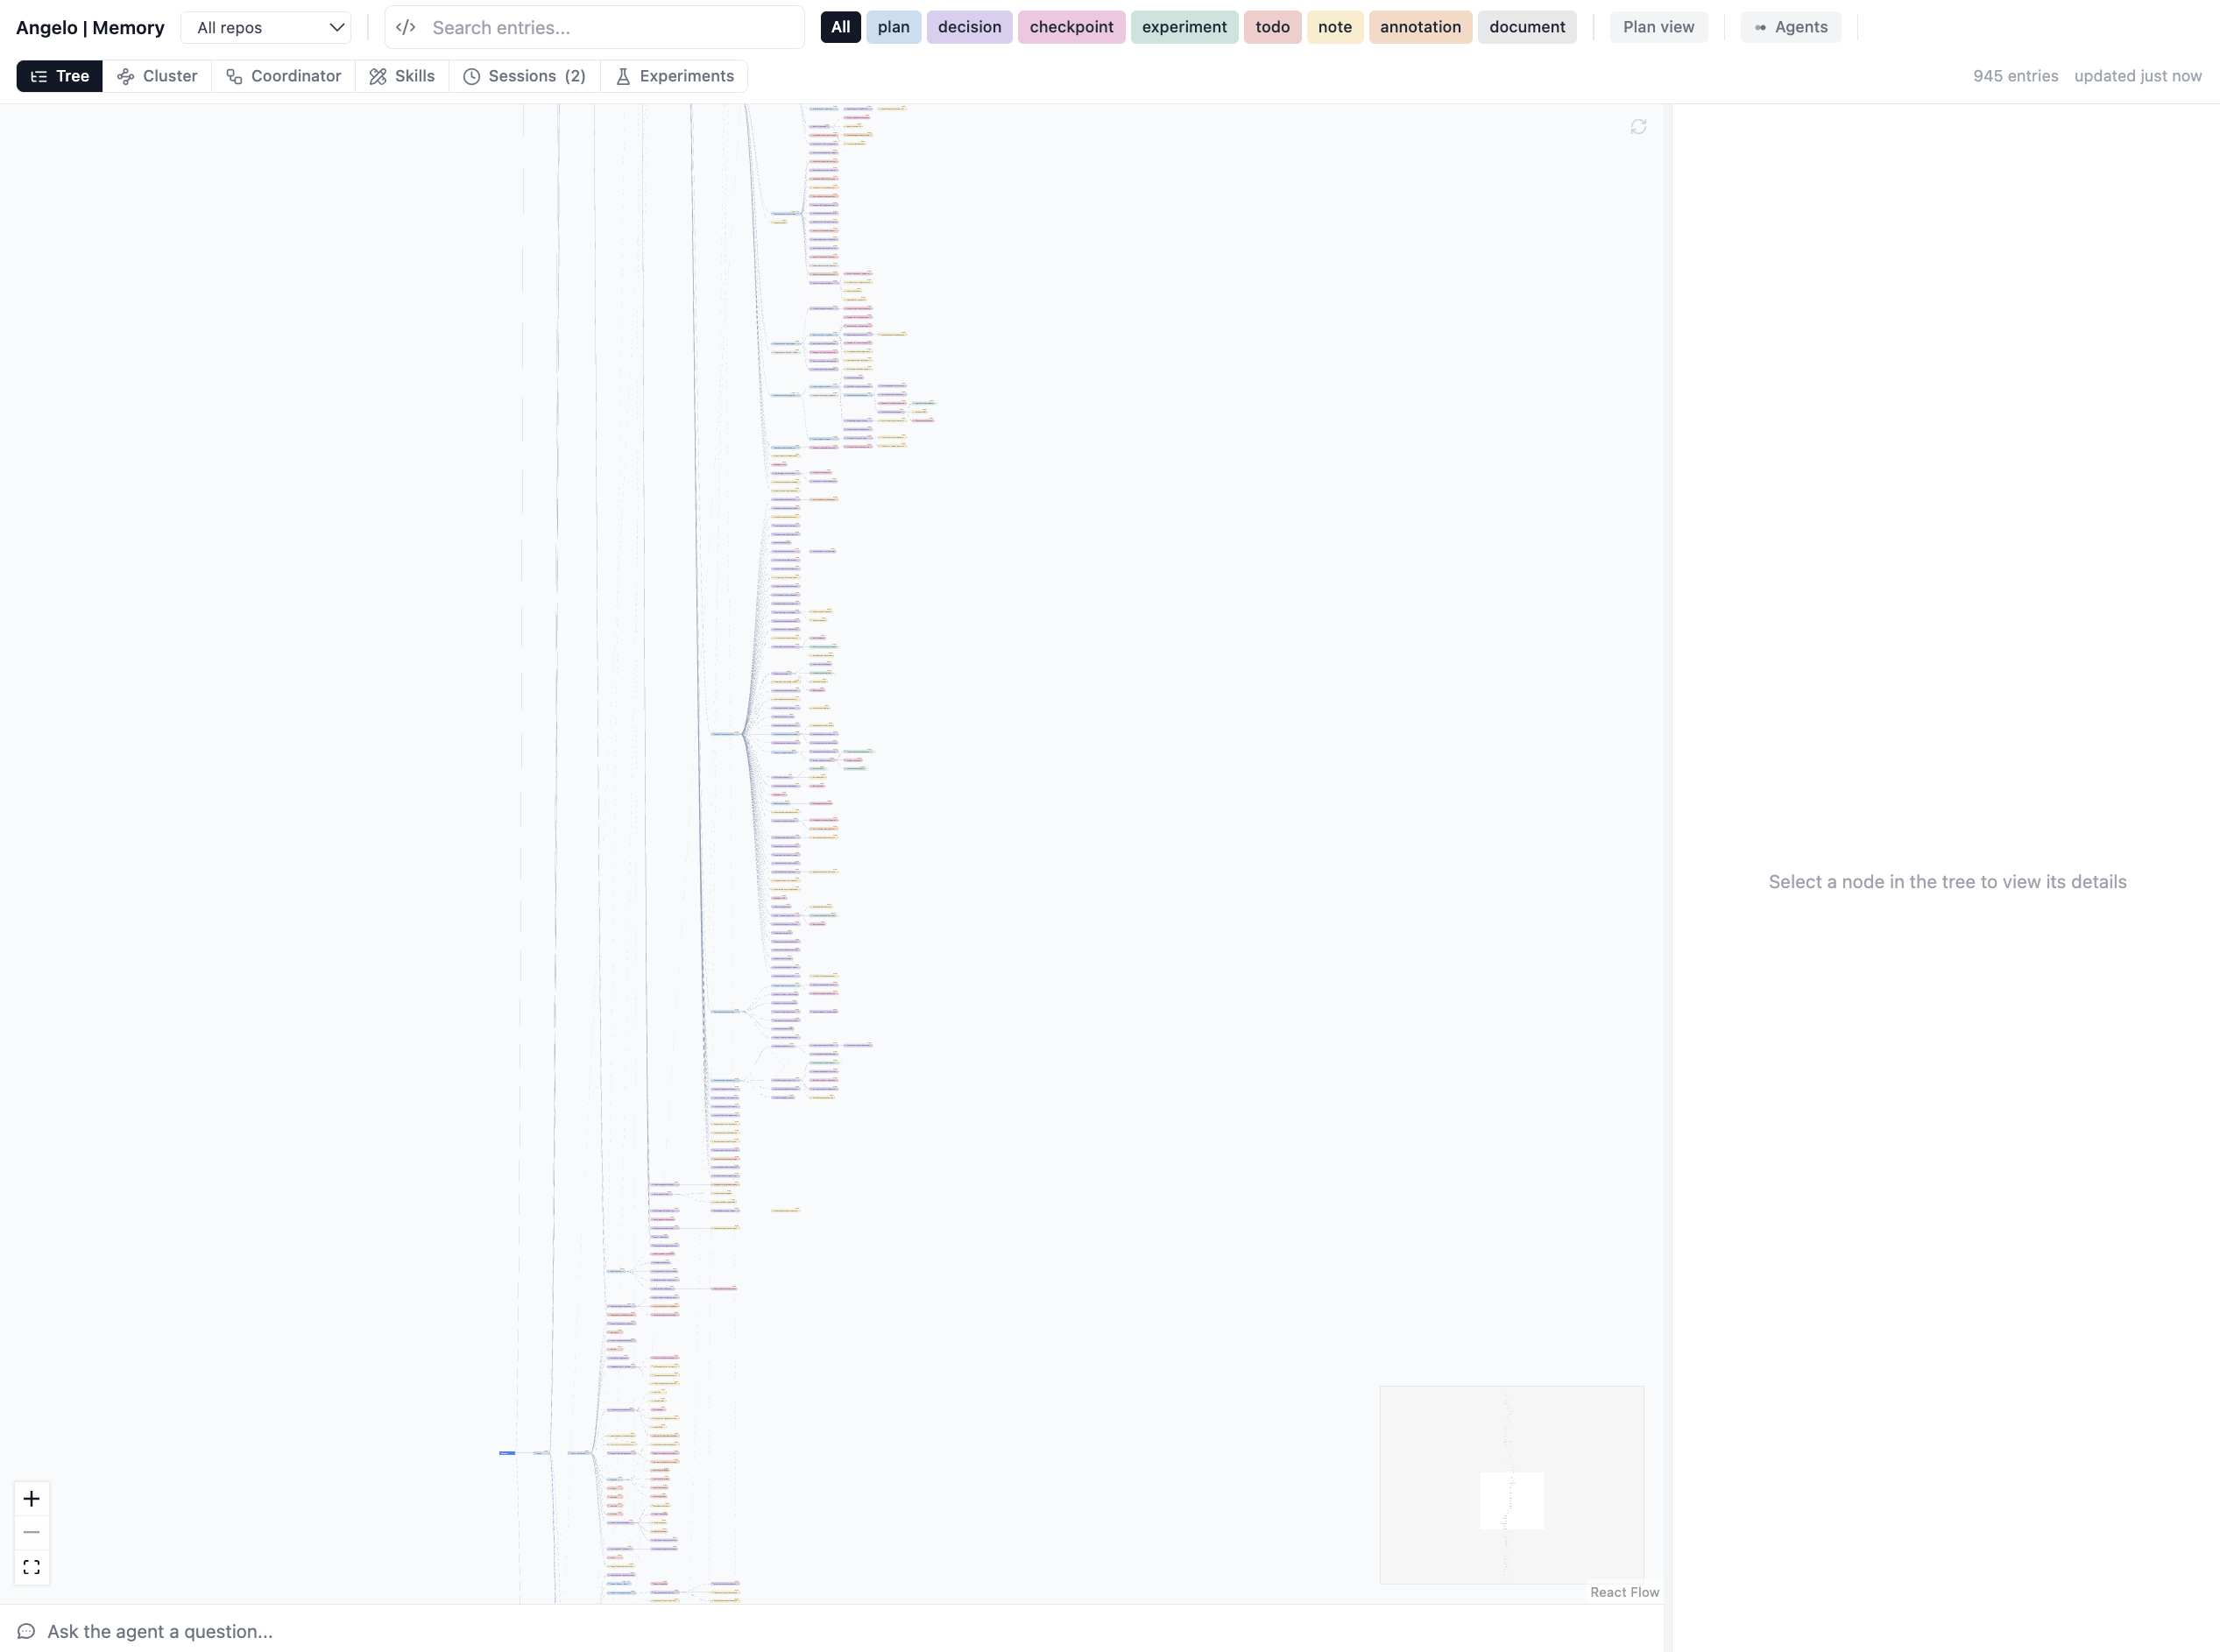
The Tree view — the research tree projected from .memory/, entries colored by type.
Why it exists
The memory tree is plain markdown under .memory/ (see
Memory). That is excellent for agents and git, but a directory of
hundreds of frontmatter-laden files is a poor way for a human to ask "what
happened last session?", "which skills do I have?", or "is the coordinator run
still going?". The dashboard answers those questions by projecting the same files
into views a person can scan — without ever becoming the place the data lives.
Two design commitments fall out of that:
.memory/stays the source of truth. The dashboard never owns state it could lose. It rebuilds everything it shows from the markdown files (and a few runtime sidecars), so deleting its cache costs nothing.- The dashboard runs separately from the agents. Each editor chat is its own memory MCP process; the dashboard is yet another process. They coordinate only through files on disk, which is what makes the live views possible at all (a chat in one window shows up as a card in the dashboard in another).
How it works
The backend (routes.py)
serves a built React frontend plus a JSON API. Most read endpoints go through a
lazy graph loader
(graph_loader.py),
which rebuilds an in-memory KGLite graph from the .memory/ markdown files and
reloads it when their mtimes change. A handful of endpoints — the live ones —
read runtime JSON sidecars directly instead of the graph.
.memory/: entries flow through the KGLite GraphLoader, while the live sidecars, coordinator state, and manifests are read straight by the API routes.The KGLite graph is a disposable cache: it is built from the files, guarded by a lock because KGLite is not safe for concurrent access, and coalesces the frontend's frequent polling into at most one rebuild per scan window. The authoritative bytes are always the markdown. The live subtabs deliberately sidestep the graph and read sidecars so they reflect this instant, not the last rebuild.
What's available
The frontend is organized into subtabs over the same backend. Three are covered here; the tree and cluster views are explained in Tree and clusters.
Skills
The Skills subtab lists the active entries in your skills library — the reusable
procedures and patterns agents save with skill(action='save'). The backend
reads skill nodes from the graph and returns each one's name, category, tags,
content, and workflow role
(/skills).
It exists so the library is browsable and editable by a human: you can read a
skill's full body, see how it is categorized, and prune stale ones, rather than
discovering them only when an agent happens to search.
Sessions
The Sessions subtab is where "what is happening / what happened" lives, and it is the clearest example of the source-of-truth split:
- Live session cards come from
.memory/active-sessions/*.jsonsidecars. Every running memory MCP process publishes its own sidecar with a heartbeat, the entries it has touched, and its PID. The dashboard reads these directly, so a chat running in another window appears here as a live card. Multiple concurrent chats show up as separate cards. - Liveness is honest, not assumed. A sidecar is treated as stale (not live)
once its heartbeat ages past the stale threshold, or once its named PID is
verifiably gone. A sidecar from a dead process that recorded no activity is pure
noise, so the reader deletes it instead of showing a ghost card. The dashboard
itself publishes a single presence sidecar
(
presence.py) so that "the dashboard is running" is visible even when no chat is open — using a stable id so relaunching refreshes one card instead of piling up duplicates. - History comes from finalized
sessionnodes in the graph (written bysession(action='handoff')). The view also discovers orphaned sessions — entries that reference asession_idwith no session node and no sidecar, which happens when an MCP process exits without handing off — and synthesizes a card from the entries it created.
Why two sources for one view
Live state must reflect this instant (so it reads sidecars), while history must
survive process death and ride along in git (so it reads the committed tree).
Merging them in the /sessions endpoint is what lets a single list show both a
chat that is typing right now and a session that ended last week.
Experiments
The Experiments subtab surfaces experiment provenance. The backend joins two
things: DVC-backed manifests (a run's code SHA, data hashes, command, and
artifacts) and memory experiment entries (the human-meaningful record in the
tree). Runs that share an experiment family collapse into one card carrying the
latest run plus a newest-first history, so a rerun bumps its experiment to the
top. The view splits research experiments from lighter-weight tests so the
two are not confused
(/experiments).
It exists to make reproducibility legible: you can see what was run, against which
commit, whether the working tree was dirty, and where the artifacts went.
Execution monitor
When a coordinator run is in flight, the dashboard renders it as
a live monitor: one card per run, drawn from the coordinator's state files via the
/coordinator-status endpoint, showing the task DAG and each task's progress. A
run is marked active while tasks remain and its heartbeat is fresh, and stale
once it goes quiet past the threshold — mirroring the same honest-liveness rule the
session cards use. The monitor is positioned in the graph at the tree node where
the run will record its output (its target_entry_id), so you watch the work
happen where its results will land.
Related
Semantically related entries from the memory graph.